Next-Gen App & Browser Testing Cloud
Trusted by 2 Mn+ QAs & Devs to accelerate their release cycles

- Home
- /
- Learning Hub
- /
- How to Measure Cypress Code Coverage
How to Measure Cypress Code Coverage
Learn Cypress code coverage from scratch. Install plugins, configure, collect data, and combine reports to improve test reliability.

Harita Ravindranath
January 11, 2026
Cypress code coverage shows you which lines of code in your application are executed during end-to-end tests, highlighting untested areas. It helps you evaluate test effectiveness, refine your QA approach, and ensure your development cycles produce well-tested, high-quality web applications that meet both functional and non-functional requirements.
Overview
Cypress code coverage tracks which lines, branches, and functions of your application’s source code are covered during Cypress test execution, revealing gaps and assessing your test suite’s effectiveness.
How to Set Up Cypress Code Coverage?
To set up Cypress code coverage, you can follow these steps to install, configure, instrument, run tests, and generate coverage reports efficiently.
- Install Plugin: Run npm install --save-dev @cypress/code-coverage to add the official Cypress plugin that enables code coverage tracking during test execution.
- Configure Support File: Add import '@cypress/code-coverage/support'; in cypress/support/e2e.js so tests can automatically collect coverage data while running.
- Configure Cypress: In the cypress.config.js file, add require('@cypress/code-coverage/task')(on, config); inside setupNodeEvents to enable the plugin to record code coverage.
- Instrument Application: For Babel projects, install babel-plugin-istanbul and add it to the .babelrc file under the test environment to track executed code lines and branches.
- Run Tests: Start your instrumented web application and execute npx cypress run to collect raw coverage data automatically during test execution.
- Generate Report: Install nyc with npm install --save-dev nyc and run npx nyc report --reporter=html to produce a visual coverage report in HTML.
How to Combine Cypress Code Coverage From Parallel Tests?
Parallel Cypress test runs produce separate coverage data; combining these reports ensures complete visibility of tested and untested code, with the following steps guiding you through the process.
- Parallel Tests: When running Cypress tests across multiple instances, each produces separate coverage files in .nyc_output/, requiring careful merging for accurate code coverage.
- Coverage Files: Ensure each test instance writes coverage data to a unique file. After all parallel runs finish, consolidate these files into the .nyc_output/ folder.
- Merge Command: Navigate to .nyc_output/ containing JSON coverage files, then run the nyc merge .nyc_output/ merged-coverage.json command to combine them into a single merged coverage file.
- Alternate Path: If .nyc_output/ exists inside a subfolder like coverage/.nyc_output/, adjust the merge command path to accurately consolidate coverage across all parallel runs.
- Generate Report: Use the command: nyc report --reporter=html --report-dir=coverage --temp-directory=. --temp-file=merged-coverage.json to create a unified HTML code coverage report from the merged JSON file.
- Report Options: The --reporter=html flag generates a readable HTML report, --report-dir specifies the save location, and --temp-file points to the merged coverage JSON.
- View Report: Open the HTML report in a browser using the open coverage/index.html command to inspect consolidated code coverage metrics from all parallel Cypress test runs.
What Is Cypress Code Coverage?
Code coverage in Cypress tests measures which lines, branches, or functions of your web application’s source code are executed during tests. It helps identify untested areas and improve the completeness and reliability of your test suite.
Key aspects include:
- Instrumentation: This involves adding counters to your source code to track executed lines, branches, and functions. Common tools for this are Istanbul.js and NYC.
- Plugin Integration: Cypress does not provide native code coverage, but the @cypress/code-coverage plugin integrates instrumentation and reporting seamlessly into your test workflow.
- Report Generation: When tests run with instrumentation enabled, the plugin collects coverage data and generates reports in formats like LCOV (for SonarQube) or HTML for visual analysis.
- Build Tool Integration: Coverage tasks can be automated through package.json scripts, enabling report generation and analysis as part of CI/CD pipelines.
How to Configure Code Coverage in Cypress?
In Cypress, code coverage capability is not a default built-in feature of the framework. To enable it in your project, Cypress offers an official @cypress/code-coverage plugin, which requires a few configuration settings.
Prerequisites
Before we begin, make sure you have:
- An existing Cypress project. This Cypress tutorial uses v14, which follows the modern configuration structure introduced in v10 and later.
- Node.js and npm installed.
- A JavaScript or TypeScript web application, optionally using Babel through a bundler such as Webpack, Vite, or Create React App (CRA).
Install the @cypress/code-coverage Plugin
To enable Cypress code coverage, the steps below will guide you through setup, configuration, and integration into your testing workflow.
Step 1: Install the Cypress code coverage plugin in your project using the command below:
npm install --save-dev @cypress/code-coverageStep 2: Add the Cypress code coverage plugin to your support e2e.js file. It enables coverage tracking during test execution.
Step 3: Add the code coverage plugin to your cypress.config.js file. Then, update the setupNodeEvents function to include the code coverage task.
// cypress.config.js
const { defineConfig } = require("cypress");


module.exports = defineConfig({
 e2e: {
   setupNodeEvents(on, config) {
    require('@cypress/code-coverage/task')(on, config)
     return config
   },
 },
});

Note: If you're using TypeScript with Cypress, the setup for code coverage remains nearly the same. Just ensure your support and config files use .ts extensions and typings are properly handled.
Instrument Web Application for Cypress Code Coverage
In Cypress, the instrumentation process adds counters to your code that record how often specific lines, functions, statements, branches, and conditions are executed during test runs. It provides the data needed to generate accurate code coverage reports.
The @cypress/code-coverage plugin does not handle instrumentation by itself. To achieve it, you’ll need to manually instrument your web application.
For Babel-based projects, you can use the babel-plugin-istanbul plugin to instrument your app.
The babel-plugin-istanbul plugin works by injecting coverage tracking counters into your JavaScript-compiled code as part of its transpilation.
Let’s set up instrumentation for our Babel project.
Step 1: Install the babel-plugin-istanbul plugin using the command below:
npm install --save-dev babel-plugin-istanbulStep 2: Update your .babelrc configuration file to include the babel-plugin-istanbul plugin.
"plugins": ["istanbul"]If you don’t have this file already, create one. It is best to limit this plugin to the test environment only. Your final .babelrc file might look like this:
// .babelrc
{
 "presets": ["@babel/preset-env"],
 "env": {
   "test": {
     "plugins": ["istanbul"]
   }
 }
}
Note: And for projects not using Babel, you still have many ways to implement Cypress code coverage. Based on your build tool, you can opt for plugins like istanbul-instrumenter-loader, vite-plugin-istanbul, etc.
Note: Run Cypress tests in parallel on the cloud. Try TestMu AI Now!
Collect Code Coverage With Cypress
With instrumentation in place, you need to start your web application on a local server. It ensures the browser loads the instrumented code containing coverage counters.
Note: If you've configured Babel to apply instrumentation only in the test environment, make sure to set NODE_ENV=test when running your web application.
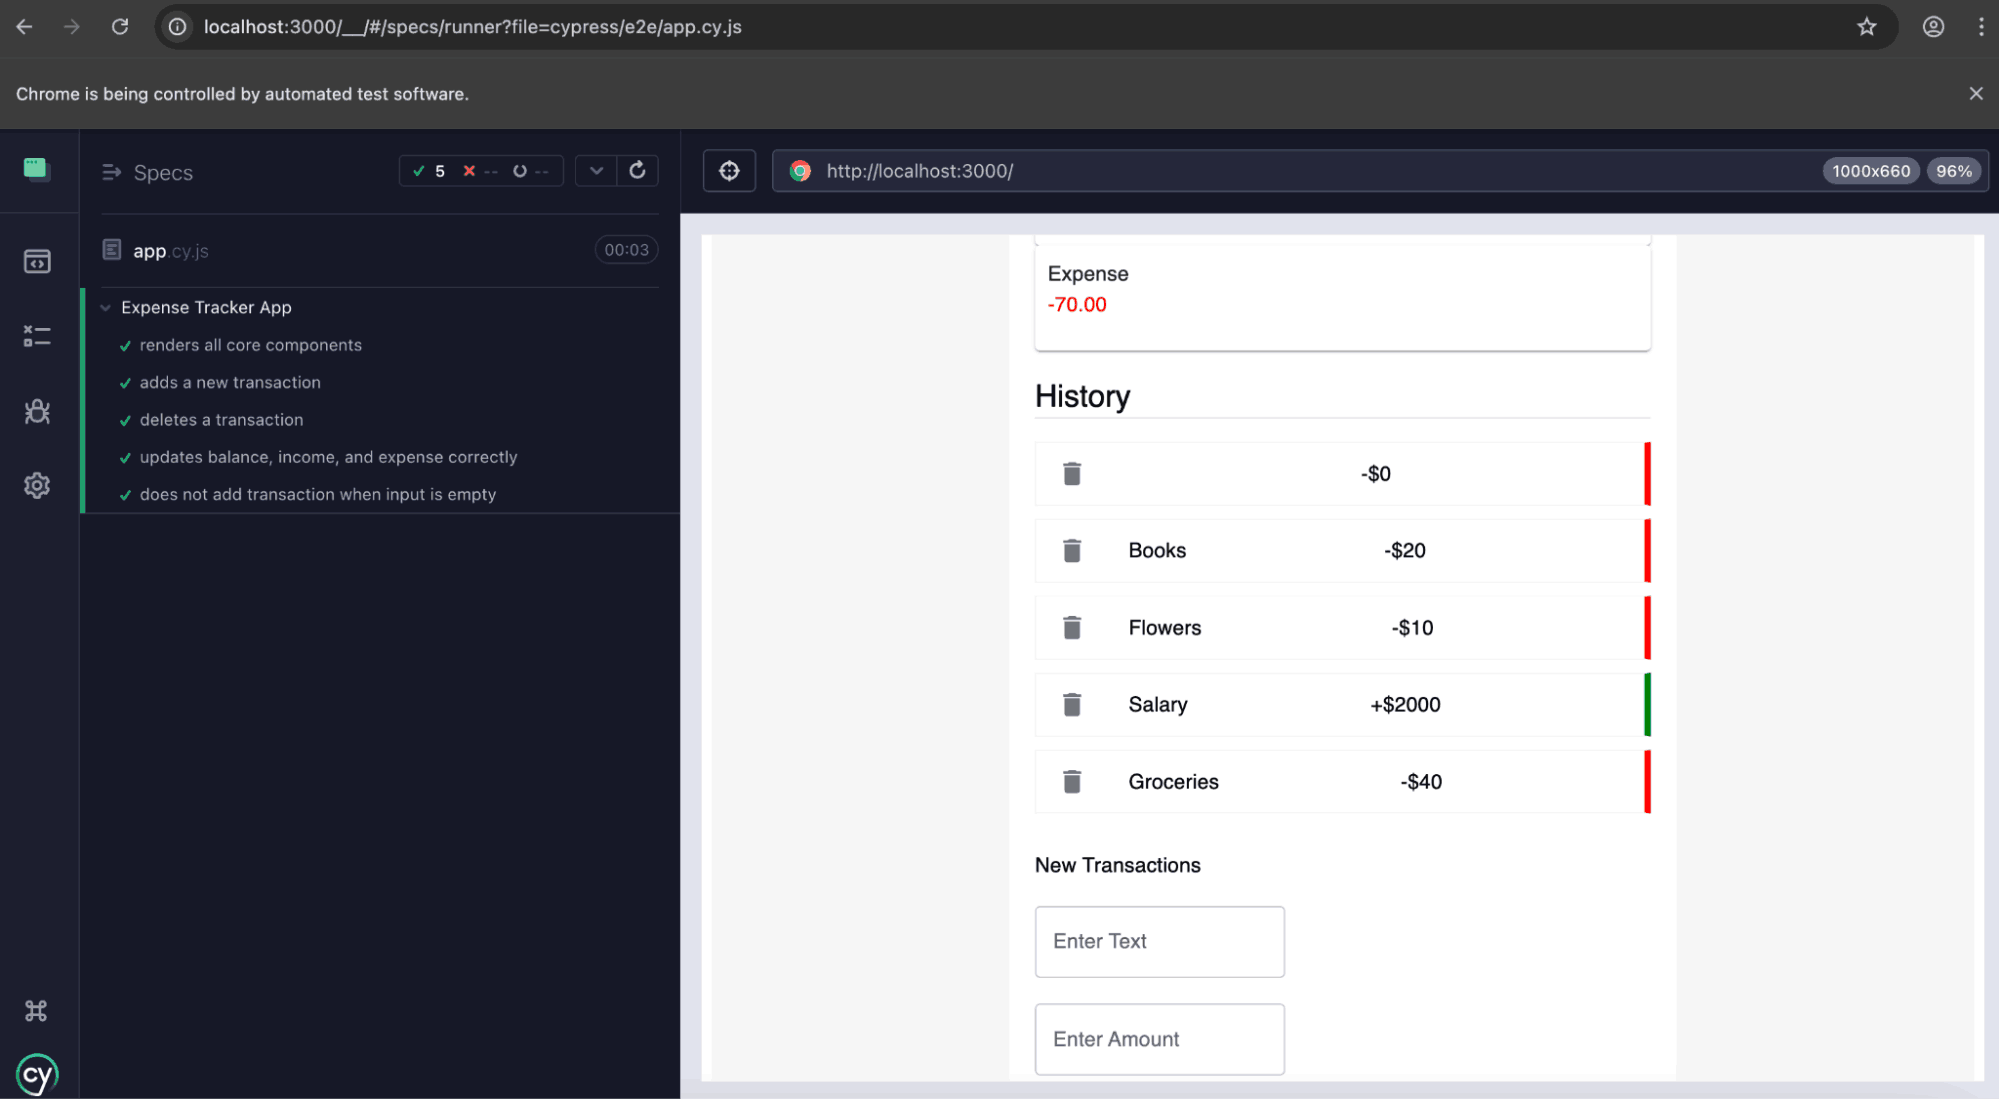
Once the web application is running, you can execute your Cypress test suite using:
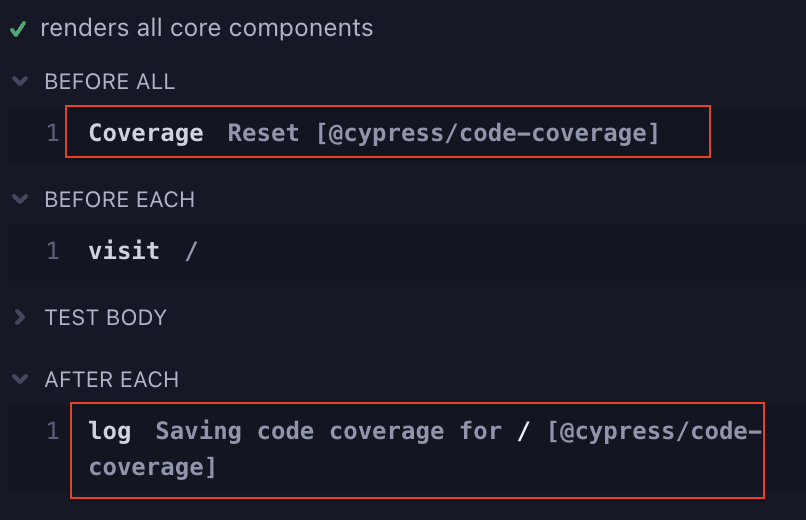
npx cypress runIf you inspect the completed tests, you can see that a few coverage-related commands are added before and after each test, as highlighted below.
After the test run is completed, the plugin will create a .nyc_output folder in the project root, and the raw coverage data will be collected and saved here as a JSON file. At this stage, we can ensure that the web application is instrumented correctly.
Generate and View Cypress Code Coverage Reports
After successfully instrumenting your code and completing the test run, the final step is to generate the code coverage reports. It can be done easily using the nyc CLI - the state-of-the-art command-line interface for Istanbul. With nyc, you can create reports in multiple formats, including HTML, LCOV, text, and more.
The steps are as follows:
Step 1: Install nyc using the below command:
npm install --save-dev nycStep 2: Make sure your web application is running with instrumentation:
NODE_ENV=test npm run startThen run Cypress:
npx cypress runAfter the test run is completed, the raw coverage data should be saved in the .nyc_output/ folder.
Step 3: To create an HTML report, run:
npx nyc report --reporter=html && open coverage/index.htmlThe generated report will be available at coverage/index.html file.
The report provided a visual breakdown of:
- Which files and lines were executed during the test.
- Which lines were untested or missed.
- Coverage percentages for statements, branches, functions, and lines.
In this example, we can see that the Transaction.jsx component file is only covered 75% by the tests. We can even drill down to the individual files and see what code is missed from testing.
Through the report, you can easily visualize code coverage, identify gaps, add new tests for untested code, and ultimately improve the overall robustness and quality of your software.
Tip: You can also generate reports in other formats. To see a text summary report, run the command below.
npx nyc report --reporter=text-summary
To generate reports in multiple formats simultaneously, simply pass additional reporter parameters.
npx nyc report --reporter=html --reporter=lcovHow to Combine Cypress Code Coverage From Parallel Tests?
In a real-world scenario, most likely, your Cypress test suite might contain hundreds of test cases that will be executed in parallelly across multiple instances. Then, each instance will generate its own coverage data, resulting in separate files in the .nyc_output/ folder.
To get a unified view of your application’s code coverage, it would be best to merge them all into a single report.
Let’s see how we can do it:
Step 1: Ensure that each parallel test instance saves its coverage data into a unique file. After all parallel jobs are completed, collect all files into one space, the ./nyc_output folder.
Step 2: Navigate to the ./nyc_output folder where all JSON files are gathered and run the below merge command:
nyc merge .nyc_output/ merged-coverage.jsonThis command merges all individual coverage JSON files into a single file merged-coverage.json.
Note: If the ./nycoutput folder is located inside another folder (e.g., coverage/.nycoutput/), make sure to update the path accordingly:
nyc merge coverage/.nyc_output/ merged-coverage.json
Step 3: Generate the combined coverage report using the command below:
nyc report --reporter=html --report-dir=coverage --temp-directory=. --temp-file=merged-coverage.json- --reporter=html: Generates an HTML report.
- --report-dir: Specifies where the report will be saved.
- --temp-file: Points to the merged coverage JSON file.
Step 4: Use the command below to open the generated report in a browser to see your consolidated code coverage across all parallel Cypress runs:
open coverage/index.htmlHow to Run Cypress Tests in Parallel With TestMu AI?
If you’re looking to run your Cypress tests faster and across different environments, TestMu AI makes the whole process a lot easier. As a cloud-based cross-browser testing platform, TestMu AI allows you to perform Cypress parallel testing across a wide range of browsers, operating systems, and device configurations. This parallel execution not only speeds up your test cycles but also ensures broader coverage.
Features:
- Cross Browser Testing: Perform cross browser testing across 40+ browser versions, including Chrome, Firefox, and Edge, to ensure consistent application behavior across different environments.
- Comprehensive Test Logs: Access detailed logs for each test run, including console logs, video recordings, and command logs, to facilitate thorough debugging.
- Real-Time Analytics: Monitor test progress and results in real-time through TestMu AI's intuitive dashboard, enabling quick identification and resolution of issues.
- CI/CD Integration: Integrate Cypress parallel tests into your existing CI/CD pipelines for automated and continuous testing workflows.
- TestMu AI Tunnel Integration: Test locally hosted or private web applications securely through the TestMu AI Tunnel, ensuring comprehensive test coverage.
To get started, check out this guide on Cypress testing with TestMu AI.
Follow these steps to seamlessly integrate your Cypress project with TestMu AI:
Step 1: Install the TestMu AI CLI globally using the below command:
npm install -g lambdatest-cypress-cliStep 2: Run the below command to create a TestMu AI configuration file:
npx lambdatest-cypress init --cv=14This command will create a TestMu AI-config.json file with sample configurations. You can customize this to suit your project setup.
If your web application is running locally, set "tunnel": true inside the tunnel_settings section to enable local page testing via TestMu AI cloud grid.
{
   "lambdatest_auth": {
      "username": "<Your LambdaTest username>",
      "access_key": "<Your LambdaTest access key>"
   },
   "browsers": [
      {
         "browser": "Chrome",
         "platform": "Windows 10",
         "versions": [
            "latest-1"
         ]
      },
      {
         "browser": "Firefox",
         "platform": "Windows 10",
         "versions": [
            "latest-1"
         ]
      }
   ],
   "run_settings": {
      "reporter_config_file": "base_reporter_config.json",
      "build_name": "cypress-testing-code-coverage",
      "parallels": 3,
      "specs": "cypress/e2e/**/*.cy.js",
      "ignore_files": "",
      "network": false,
      "headless": false,
      "npm_dependencies": {
         "cypress": "14",
         "@cypress/code-coverage": "^3.14.5",
         "babel-plugin-istanbul": "^7.0.0",
         "nyc": "^15.1.0",
         "babel-loader": "^8.2.5",
         "@babel/core": "^7.22.9",
         "@babel/preset-env": "^7.22.9",
         "@babel/preset-react": "^7.22.5"
      }
   },
   "tunnel_settings": {
      "tunnel": true,
      "tunnel_name": "cypress-code-coverage"


   }
}
Step 3: Run the test using the below command:
npx lambdatest-cypress run --cy="--config-file cypress.config.js"This command will start executing your Cypress parallel tests on cloud-based infrastructure. The tests will automatically be split and distributed based on the defined concurrency.
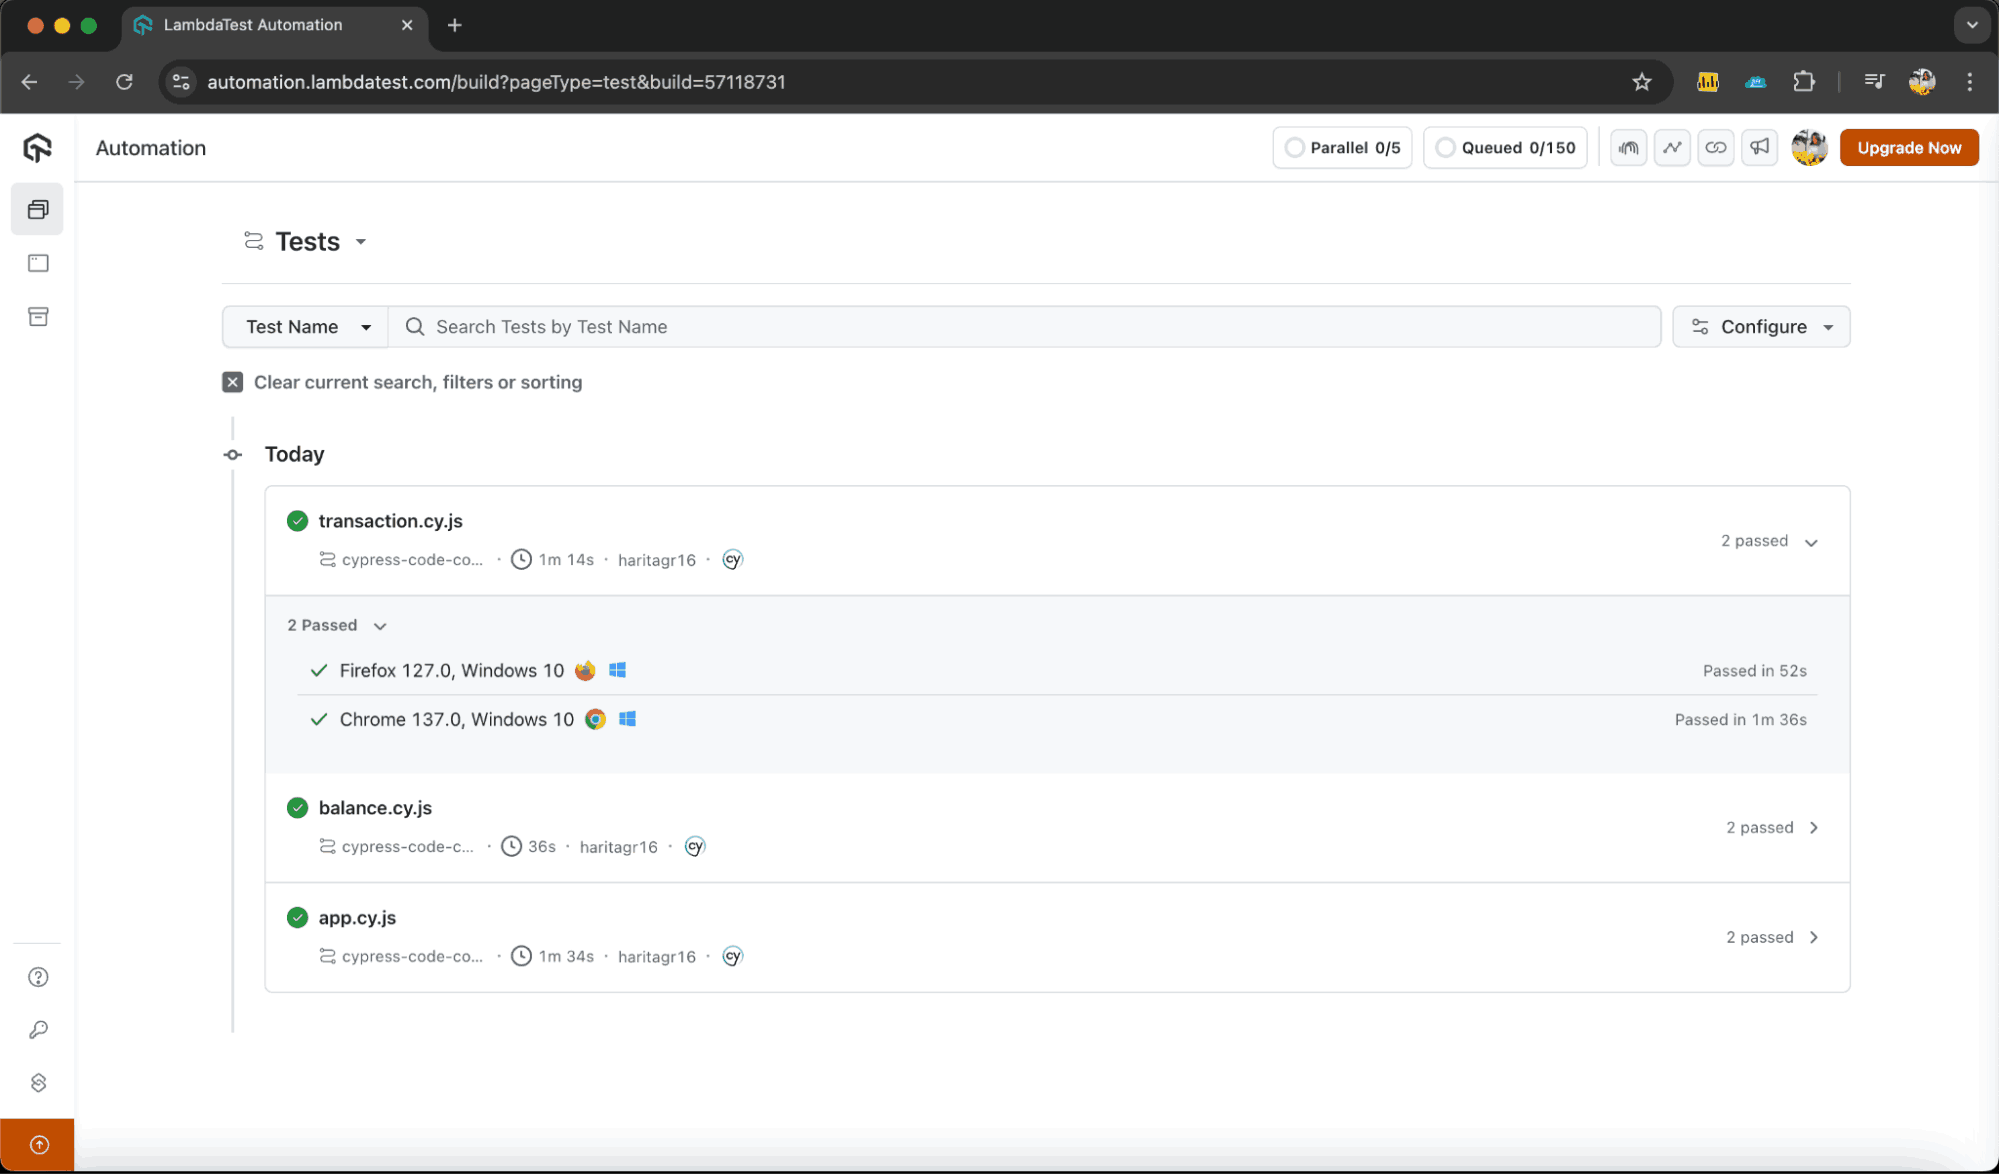
You can see the test execution results on the TestMu AI Web Automation dashboard.
Troubleshooting Code Coverage Issues in Cypress
While Cypress code coverage can be incredibly useful, it does have its limitations and occasional pitfalls. Let’s discuss some of the most common issues faced by developers during code coverage implementation, along with practical tips to help you identify and resolve them.
- Instrumentation Overhead: Through instrumentation, you are injecting additional code into your application. While effective, this added logic can increase the complexity of your codebase and inevitably slow down your tests. In large and fast-evolving projects, instrumentation can cause overhead in both performance and maintenance.
- Optimize your test scope. Avoid over-testing by hitting unnecessary routes.
- Use cy.session() to cache session data and reduce redundant steps.
- Run tests on Cypress cloud infrastructure like TestMu AI to mitigate local performance bottlenecks and speed up execution time.
- Code Coverage Limits: While Cypress code coverage tells you which lines were executed, it should be kept in mind that the user interacts with the web application in terms of features, not code lines. Chasing 100% code coverage can lead to over-testing or testing trivial things while missing critical user flows.
- Shift your focus to testing real user flows and interactions rather than just achieving high code coverage.
- Use Cypress UI coverage to visualize test coverage of UI elements. This helps in bridging the gap between code and user experience.
- Supplement code coverage with other testing methods like Cypress visual regression testing.
- Third-Party Site Issues: Tests that rely on external services can be flaky and unpredictable. These sites may experience downtime, have anti-automation policies, and undergo frequent changes, all of which can lead to false failures in your test suite.
- Avoid dependency on external sites as much as possible during test runs. Wherever possible, make use of stub or Mock APIs.
- If unavoidable, make sure you have implemented proper error handling and retry mechanisms for external calls.
Solution:
Solution:
Solution:
Conclusion
Code coverage is a powerful software testing metric that helps you gain deeper insights into how much of your code is exercised by your automation tests. In this tutorial on Cypress code coverage, we explored how to implement code coverage through instrumentation and generate meaningful reports to guide better testing.
That said, code coverage is just one part of ensuring quality. High code coverage does not always mean high-quality tests. By combining it with thoughtful test design, visual testing, robust CI/CD strategies, and leveraging cloud platforms like TestMu AI for faster parallel execution, you can build a reliable, scalable, and maintainable test automation strategy that truly improves the quality of your web application.
Citations
- Cypress Code Coverage Documentation: https://docs.cypress.io/app/tooling/code-coverage
- Cypress Code Coverage Plugin: https://github.com/cypress-io/code-coverage
- Babel Plugin Istanbul: https://github.com/istanbuljs/babel-plugin-istanbul
Frequently asked questions
Did you find this page helpful?
More Related Hubs
TestMu AI forEnterprise
Get access to solutions built on Enterprise
grade security, privacy, & compliance
- Advanced access controls
- Advanced data retention rules
- Advanced Local Testing
- Premium Support options
- Early access to beta features
- Private Slack Channel
- Unlimited Manual Accessibility DevTools Tests
