
Next-Gen App & Browser Testing Cloud
Trusted by 2 Mn+ QAs & Devs to accelerate their release cycles

Unleashing Cypress Performance Testing using Lighthouse
Unlock the power of Cypress performance testing with Lighthouse. Measure speed, SEO, accessibility, and best practices for optimal user experience and performance.

Narayanan Palani
January 30, 2026
Performance testing is crucial to ensure websites and applications load quickly and deliver a seamless user experience. Cypress, combined with Google Lighthouse, allows you to automate performance audits, identify slow-loading pages, and detect broken links efficiently. This blog explores how to leverage Cypress for performance testing, highlighting why it’s essential and how it can help maintain a reliable, high-performing web application.
Before we get started with Cypress performance testing using Lighthouse, let’s look at the ‘what’ and ‘why’ of performance tests.
Overview
How to Use the cypress-audit Plugin for Cypress Performance Testing?
The cypress-audit plugin integrates Google Lighthouse and accessibility audits into your Cypress tests, automating the measurement of page performance, accessibility, SEO, and best practices.
- Install the Plugin: Add cypress-audit to your project using npm or Yarn.
- Set Up Audits: Prepare the plugin in Cypress so audits run during your test execution.
- Integrate in Tests: Trigger audits at key points, such as after visiting pages or completing actions.
- Define Thresholds: Specify minimum scores for performance, accessibility, SEO, and PWA. Tests fail if metrics fall below these limits.
- Monitor Continuously: Automate audits in CI/CD pipelines to catch issues early and maintain high web standards.
What Are the Steps to Set Thresholds for Cypress Performance Testing?
Setting thresholds with the cypress-audit plugin ensures that your performance, accessibility, and SEO standards are consistently met.
- Inline Thresholds in Test Steps: Define expectations directly within test steps for immediate, scenario-specific checks.
- Centralized Threshold Constants: Store threshold values in a shared constant or config file, making them reusable and easier to maintain.
- Trigger Audits in Tests: Run audits at critical points like page loads or after key interactions.
- Automatic Pass/Fail Evaluation: Cypress compares metrics against thresholds; if below, the test fails, providing instant feedback.
- Integrate in CI/CD: Apply thresholds in automated pipelines for continuous monitoring and consistent performance standards.
What Are the Alternate Plugins for Cypress Performance Testing?
While cypress-audit and cypress-lighthouse are popular, there are other plugins for enhancing web performance in Cypress tests:
- cypress-performance: Captures real-time performance metrics using the Navigation Timing API, tracking page load, DOM content load, and resource timing.
- cypress-axe: Focuses on accessibility audits to detect violations during web page testing.
- cypress-speed: Measures page transition and user action speeds, providing insights into performance bottlenecks.
- cypress-web-vitals: Integrates Google’s Core Web Vitals into Cypress tests for tracking LCP, FID, and CLS metrics.
- Custom Lighthouse Integration: Run Lighthouse audits externally and integrate results into Cypress reports via API calls or JSON reports.
What Challenges Can Arise When Testing Large-Scale Web Applications With Cypress and Lighthouse?
Large applications with hundreds of pages can cause long execution times or timeouts. Ensuring tests remain stable requires parallel execution, efficient retry mechanisms, and careful configuration of thresholds. Cloud-based testing can help scale the tests without slowing down feedback loops.
What are performance metrics KPIs for websites?
The standard load time of any NodeJS-based web application is 2 seconds which also includes loading of interactive content present on the website. Needless to mention that you need to fix it in case the load time exceeds more than 2 seconds! The story is not over yet!
Even when the page loads the content, the entire page should get loaded in not more than 3 seconds. The Lighthouse plugin from Google Chrome is one of the powerful tools to get a performance score similar to the performance tab of Chrome Dev Tools. In addition, Lighthouse CLI can also be used for performing audits right from the command line! Though there are six performance metrics in Lighthouse 6.0, FCP (First Contentful Paint) and Time to Interactive (TTI) are the major ones that should be considered as a top priority.
Here are the ideal values for the important Lighthouse performance metrics that should be considered for websites (or web applications):
Metrics Type | Best Score/Minimum Standards | Location of the tool |
|---|---|---|
Performance Metrics Score | 95 percent | Lighthouse plugin (from Google Chrome → More Tools → Developer Tools) |
First Contentful Paint | Maximum 1-2 seconds | |
Time to Interactive | Maximum 2-3 seconds |
For more accurate results, it is recommended to disable cache from the network tab (inside Developer Tools of Google Chrome). Post that, you should retry to get the metrics from Google Lighthouse. Lighthouse v6 is available from Google Chrome v84 onwards. Since Lighthouse is available as a plugin for Cypress, it is recommended to use Cypress and Google Lighthouse combination for web performance testing.
Scripting is a key metric calculated to determine how fast the web pages are getting loaded for the end-user. On similar lines, rendering and painting give the CSS load time depending on the type and category of React apps.

What is Cypress?
For starters, Cypress is a JavaScript-based front-end testing tool that is primarily suited for testing modern web applications. Unlike other test automation frameworks like Selenium, Cypress operates directly inside the web browser and comes with a unique DOM manipulation technique. Check out our Cypress vs Selenium comparison if you want to check out the best of both the test automation frameworks.
Getting started with Cypress is easy in case you are coming from a JavaScript background. Cypress is one of the few test automation frameworks ideal for E2E (End-to-End) testing, integration testing, unit testing, and more.
Check out the video from the TestMu AI YouTube channel that deep dives into how to get started with Cypress automation testing:
QA engineers prefer Cypress automation testing since there are minimal chances of witnessing flakiness in Cypress tests. Recently, Cypress has come up with a retry mechanism in which you can set the retry value as 2 in cypress.json to get the same test retried twice if it had earlier failed due to issues like delayed load time.
Getting performance metrics for each page based on its load time can be extremely time-consuming if the project has close to 40 to 200 web pages. The number of pages depends on the user journey. Now that we have covered the essentials of What is Cypress, let’s look at how to implement web performance testing to automate those web pages using Cypress and Google Lighthouse in Jenkins.
The cypress-audit plugin is used for Cypress performance testing since it integrates Lighthouse into the Cypress tests.
Get the best out of your Cypress tests with TestMu AI’s online Cypress automation tool. Check out how you can test your Cypress test scripts using TestMu AI’s online cloud.

How to use cypress-audit plugin for Cypress performance testing?
Before installing the cypress-audit plugin, you need to make sure that you have Cypress installed on your machine. If not, please follow the below-mentioned steps for setting up the Cypress framework:
- npm install
- npm link
- npm link cypress-cucumber-preprocessor
- npm install through
Now that Cypress is installed on your machine, it’s time to install the cypress-audit plugin for taking the first step towards web performance testing.
npm install --save-dev cypress-audit
Yarn users can install cypress-audit by triggering the following command on the terminal:
yarn add -D cypress-audit
Add the following constant in index.js that is present inside the plugins folder:
const { lighthouse, pa11y, prepareAudit } = require("cypress-audit");

After updating index.js, the next step is to write the feature file for verifying the web audit results, including the performance metrics pertaining to your area of interest. Our test scenario involves logging on to the OrangeHRM website and checking the web audit results once successfully logged in.
Feature: Login Page Verification on OrangeHRM website

    Scenario: check web page health through lighthouse audit and pa11y audit on valid login page display with login fields
          Given I open OrangeHRM homepage
          Then I should see title "OrangeHRM"
          Then I should see "LOGIN Panel" text displayed
          And I should see "Alternative Login" text displayed
          And I should see web audit results
Now that we have the feature file ready, we write the step definition in a shared js file for common usage across the framework as below:
Then('I should see web audit results', function () {
      cy.lighthouse();
    })
Now that the test is partially ready, we can measure the website’s performance against the standards we are interested in. For example, when using Cypress and Google Lighthouse, it is required to set the test threshold based on which the tests would be declared pass/fail.
Watch this video to learn how Cypress can be used to automate accessibility testing.
Setting Thresholds For Cypress Performance Testing
Thresholds for performance testing using Cypress and Google Lighthouse can be set in two different ways. The first option is by adding the threshold within the step definition file.
Adding Threshold in step definition file
Then('I should see web audit results', function () {
      cy.lighthouse({
        performance: 95,
        accessibility: 100,
        "best-practices": 95,
        seo: 85,
        pwa: 100,
      }
    );
    })
Now that the thresholds are set, it’s time to run the tests. Since the tests are using Cypress installed on the local machine, trigger the following command on the terminal to run the Cypress test:
npx cypress open
Choose the right browser and launch the test on the corresponding browser:

Here is the snapshot that indicates the progress of the test execution:

On a different note, I was running the same site in a different open-source tool to check the speed of the webpage, and the automation tool itself timed out, waiting for the page to load most of the time. As a laugh or cry moment, I dropped the plan of continuing the script in that tool 🙂

A major benefit of Cypress automation testing is that it provides an interactive playback on each step and provides options to pause & re-run the test at any moment in time.

When Cypress runs the tests for cy.lighthouse command, it loads the same page in a new tab of the browser for collecting the required metrics.

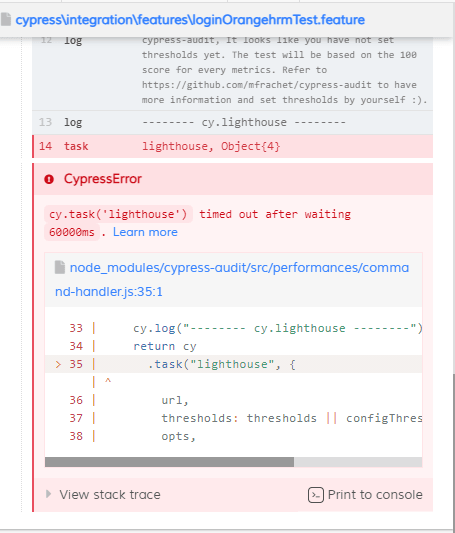
Note that I have not used any thresholds inside my cy.lighthouse command; hence the tests show a log indicating that it is appropriate to add thresholds and rerun the tests:

In few milliseconds, my tests failed due to the same reason of not having a threshold to my test:
This is where we can switch to the other option for adding the required thresholds.
Adding Threshold in a constant
In this option, we add the thresholds in a constant and call the same inside the requisite step definitions.
const lighthousemetrics = {
        performance: 95,
        accessibility: 100,
        "best-practices": 95,
        seo: 85,
        pwa: 100,
      };

    Then('I should see web audit results', function () {
      cy.lighthouse(lighthousemetrics);
    })
The cypress-audit plugin will run the tests based on the score of 100 for every metric, and the options highlighted in this section helps in adjusting the metrics as per the specific requirements. We have run the tests on Cypress that is installed on my local machine, but the approach might pose scalability challenges.
Cypress testing on cloud like TestMu AI lets you perform Cypress automation testing on a range of browser and OS combinations at an expedited pace. It is the best way to leverage the benefits offered by cloud testing.
Now Run your free Cypress parallel testing online.
Austin Siewert
CEO, Vercel
Discovered @TestMu AI yesterday. Best browser testing tool I've found for my use case. Great pricing model for the limited testing I do 👏
2M+ Devs and QAs rely on TestMu AI
Deliver immersive digital experiences with Next-Generation Mobile Apps and Cross Browser Testing Cloud
Test Execution using Lighthouse Threshold
When rerunning the tests through the ‘npx cypress open’ command, it shows the metrics after loading the page in a new tab that immediately closes after the metrics are shown. However, it shows the path of the code and the specific location in the code that has failed due to poor performance.

I was more interested in checking how Cypress evaluates the metrics on any web page in a more dynamic manner. This will also give a clear indication of the components involved in generating the required metrics.
This is possible through the ‘view trace’ option that displays the metrics of the stack trace:

When running performance metrics tests using cypress-audit based Lighthouse, it is possible to get timeouts during the test run. Hence, it is recommended to adjust the retry configuration in cypress.json while running performance tests using Cypress and Google Lighthouse.
On encountering a timeout, test execution is retried if the test has failed the first time. Alternatively, it is advisable to install the latest Cypress version, such as v7 to run the tests.
Austin Siewert
CEO, Vercel
Discovered @TestMu AI yesterday. Best browser testing tool I've found for my use case. Great pricing model for the limited testing I do 👏
2M+ Devs and QAs rely on TestMu AI
Deliver immersive digital experiences with Next-Generation Mobile Apps and Cross Browser Testing Cloud
Take this certification to showcase your expertise with end-to-end testing using Cypress automation framework and stay one step ahead.
Here’s a short glimpse of the Cypress 101 certification from TestMu AI:
Cypress-Lighthouse – Alternate Plugin for Cypress Performance Testing
Cypress comes with a best-in-class plugin called cypress-lighthouse that adds the cy.lighthouse command for auditing the website against lighthouse performance metrics.
Cypress Lighthouse plugin can be installed by triggering the following command on the terminal:
npm install cypress-lighthouse
Add the following lines in command.js to use the Lighthouse plugin for performance testing with Cypress.
import 'cypress-lighthouse';
Use the commands such as .lighthouse to verify your results.
cy.lighthouse(‘https://www.orangehrm.com/’).as('results')
Starting your journey with Cypress End-to-End Testing? Check out how you can test your Cypress test scripts on TestMu AI’s online cloud.
Conclusion
Improving the website performance is extremely important for meeting the core web vitals. Cypress and Google Lighthouse are an ideal combination for running performance tests on modern websites (or web applications). Lighthouse plugins on Cypress make it easy to perform Cypress performance testing by adding a couple of changes to the existing codebase.
A well-optimized website eventually helps build an everlasting user experience and positively impacts search engine rankings. So, if you are a user of the Cypress framework, it’s time you leverage the benefits of Cypress and Google Lighthouse for building a top-performing website (or web application).
To deepen your Cypress automation expertise, don’t miss our comprehensive guide on the top Cypress interview questions packed with insights to help you shine in your next interview.
Happy Optimization!
Austin Siewert
CEO, Vercel
Discovered @TestMu AI yesterday. Best browser testing tool I've found for my use case. Great pricing model for the limited testing I do 👏
2M+ Devs and QAs rely on TestMu AI
Deliver immersive digital experiences with Next-Generation Mobile Apps and Cross Browser Testing Cloud
Frequently asked questions
Did you find this page helpful?
More Related Hubs
TestMu AI forEnterprise
Get access to solutions built on Enterprise
grade security, privacy, & compliance
- Advanced access controls
- Advanced data retention rules
- Advanced Local Testing
- Premium Support options
- Early access to beta features
- Private Slack Channel
- Unlimited Manual Accessibility DevTools Tests