Next-Gen App & Browser Testing Cloud
Trusted by 2 Mn+ QAs & Devs to accelerate their release cycles

How To Debug HTML Errors And Fix Them?
Learn to debug HTML/CSS errors efficiently, addressing syntax, compatibility, and element alignment. Explore essential tools for seamless web development.
Vijay Kaushik
December 24, 2025
Visual errors are almost inevitable when developing a web page. It becomes frustrating when, after hours of coding, you notice that a particular element is not aligned correctly or colored, or worse, cross browser compatibility.
Debugging an HTML or CSS code can slow a developer’s creative momentum. Every issue a developer faces is unique, but coding will become much more manageable by following some basic rules and checklists.
This article will walk you through how to debug HTML, find errors, and how you can quickly fix them.
Why HTML Debugging is Important?
Debugging HTML is very crucial for effective web development. HTML, or HyperText Markup Language, is the standard language for creating and structuring web content. Properly written HTML ensures that content displays correctly across devices and browsers. Debugging HTML helps avoid issues like broken links and malfunctioning features, ensuring a seamless user experience. Misaligned elements and layout issues can make a website look distorted and lead to a bad user experience. By debugging HTML, developers can prevent these problems and maintain user engagement.
Additionally, debugging improves cross-browser compatibility, as different browsers interpret HTML and CSS differently. This ensures a consistent experience for all users. Debugging also boosts SEO performance by ensuring clean, well-structured code. It facilitates easier maintenance and modifications by keeping the codebase organized. Properly structured HTML not only improves the overall performance of the web pages but is also essential for accessibility, allowing screen readers and other assistive technologies to navigate the site effectively.
Note: Test your front end builds or web applications on 3000+ real browsers and OS options. Try TestMu AI Today!
Common HTML/CSS Errors
The following are the most common HTML/CSS errors that developers encounter during their daily work.
Syntactical Errors
One of the most common issues developers encounter in HTML is syntax errors. Even if you’re experienced, you can still make mistakes when writing lots of HTML code. These errors can cause functions not to work or programs to show the wrong results. They often happen because of small typos or forgotten closed tags. That’s why a validation tool is essential to check your HTML code. It helps you quickly find and fix these bugs, smoothing your development process.
Cross Browser Compatibility Issues
Making websites work well on different browsers can take time and effort. Your site might look amazing in one browser but wholly broken in another. This happens because each browser reads or renders HTML and CSS code in its way. These differences can be frustrating for users and developers.
Testing your website across various browsers is essential to resolve cross-browser compatibility issues. Additionally, problems can be resolved by employing tips like CSS prefixes and specific attributes for certain browsers.
Testing your website for cross-browser compatibility across various browsers and operating systems can be challenging. To simplify this process, you can utilize TestMu AI’s Realtime and RealDevice services.
TestMu AI is an AI-powered test orchestration and execution platform that lets you run manual and automated tests at scale with over 3000+ real devices, browsers, and OS combinations. With TestMu AI, you can efficiently ensure that your website functions seamlessly across different devices and platforms.
Misalignment of Elements
When things on a webpage line up differently, it can mess up how it looks and how easy it is to use. This usually happens because of problems with how elements are outlined and shown on the page.
Outlining Elements: Ensuring elements are outlined properly in HTML is important. This helps organize and show which ones are related. By using tags like < div > or < section > correctly, developers can make sure the layout looks good on different screen sizes and devices.
Display Type: The way elements are shown on a webpage depends on their display type in CSS. Choosing the right display type, like block, inline, or flex, can help developers arrange elements how they want. For instance, using the flex display type and flexbox properties makes it easy to line up elements in rows or columns.
By paying attention to how elements are outlined and picking the right display types in HTML and CSS, developers can fix alignment problems and make web layouts look better and more organized.
Tools & Tips for Writing HTML/CSS Effectively
- CSS & Markup Validator Service by W3C – The CSS & Markup Validator Service by W3C scrutinizes CSS and HTML code, ensuring adherence to official standards. It pinpoints syntax errors, deprecated elements, and non-compliant code, aiding developers in maintaining website quality. Detailed feedback assists in resolving issues, fostering adherence to high standards, and enhancing user experience.
- CSS Lint – CSS Lint is a valuable tool for developers to analyze CSS code for potential errors and violations of best practices. Flagging issues such as syntax errors and code inefficiencies help ensure cleaner and more efficient CSS coding practices, improving website performance and user experience.
- Browser Extensions – Browser extensions, like the Web Developer extension for Chrome, are invaluable tools for developers. They streamline web development tasks, offering features like outlining elements and toggling CSS properties. This extension enhances efficiency in debugging CSS and HTML issues, ensuring website quality and compatibility across browsers.
- Turn On/Off Styles – Turning on/off styles using browser developer tools simplifies CSS debugging. Developers can quickly identify style impacts on elements by toggling individual CSS properties. The browser’s element panel displays applied CSS properties, allowing for easy detection of overridden styles. While it may seem tedious, this method offers a swift way to pinpoint inconsistent styles. Developers can determine if their CSS is applied correctly or overridden by default styles, aiding in efficient debugging and ensuring website consistency and performance across browsers.


Debug HTML with TestMu AI’s Realtime Browser Testing
Ensuring that the website works seamlessly across various browsers and devices can be challenging. TestMu AI’s Realtime Browser Testing simplifies this process by offering a powerful platform to identify and resolve HTML issues in real time. With access to over 3000 real devices and browser combinations, TestMu AI allows developers to interact with their websites live, catching and fixing errors on the spot. Here’s how you can leverage TestMu AI to debug your HTML efficiently and effectively.
Step 1: Create an account on the TestMu AI platform and login.
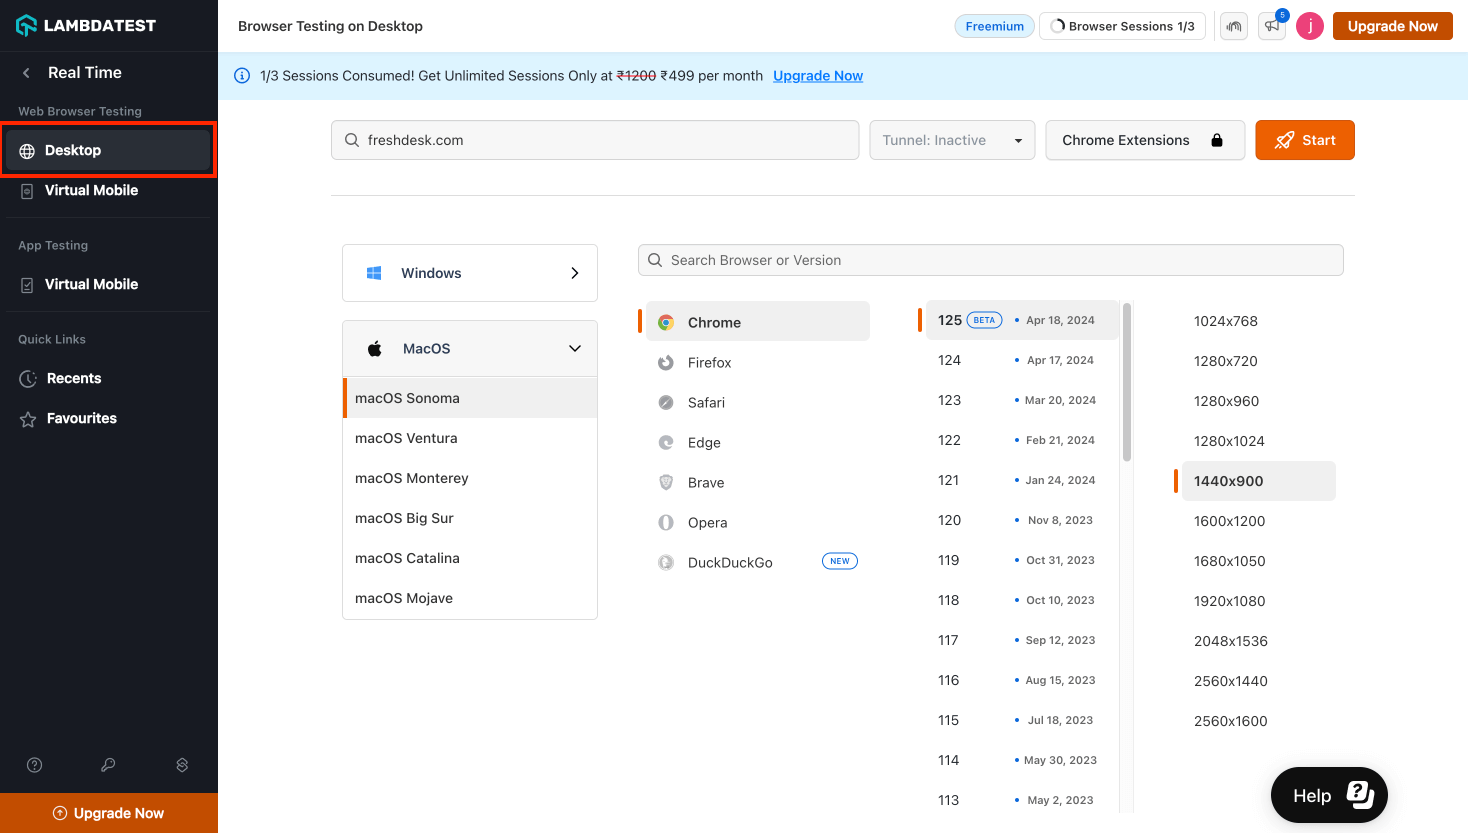
Step 2: Go to the Realtime Testing option and Select the Desktop option from the left panel.

Step 3: Now Select the Operating System and Browser version Combination, on which you want to perform the testing.
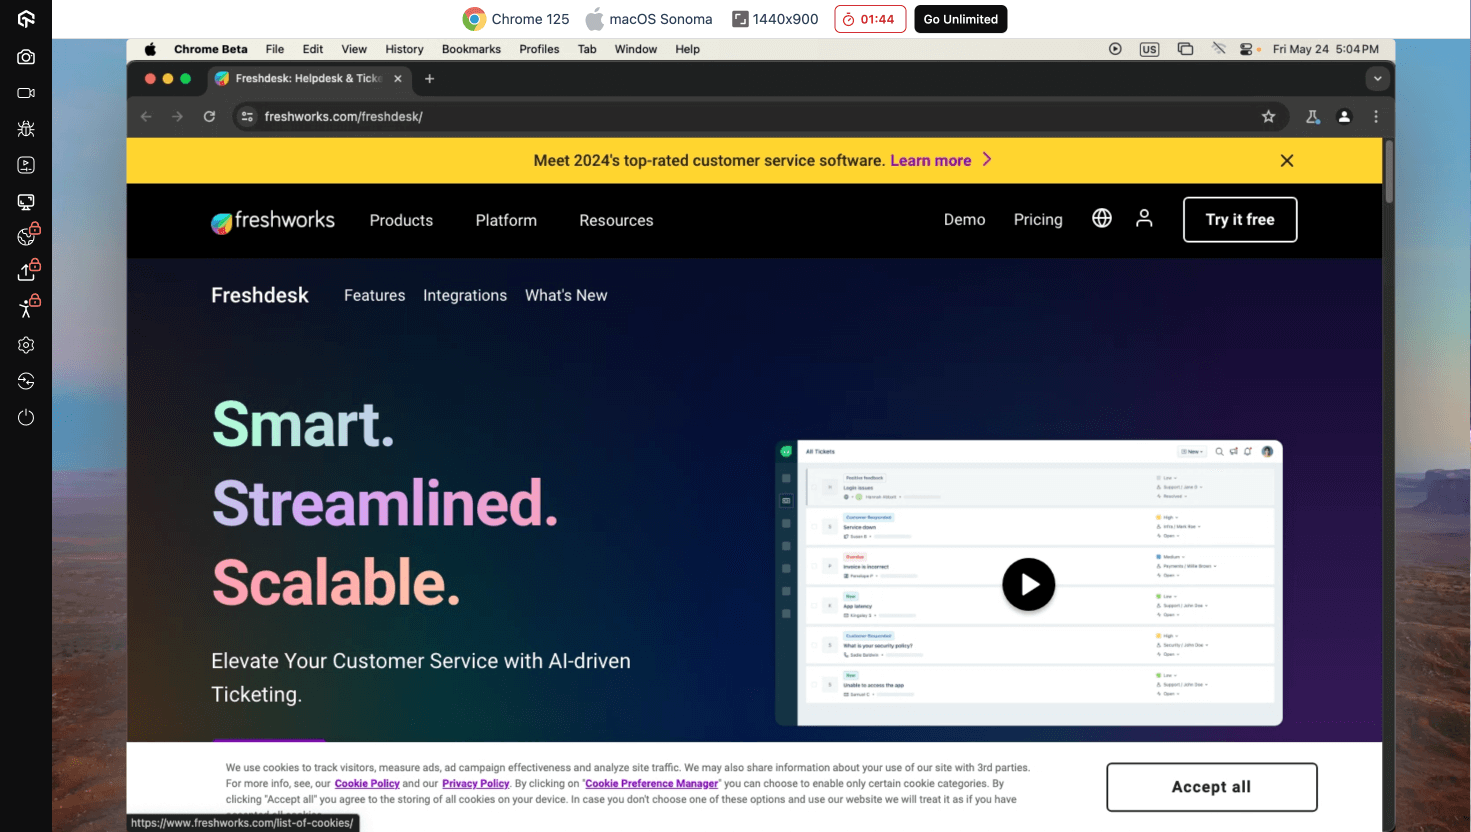
Step 4: Provide the URL of your website and Click Start. This will open up your website in the selected OS and Browser Combination.

Step 5: In this browser, one can open up the browser inspect mode to debug the HTML of the website and try out ways to fix any issues.

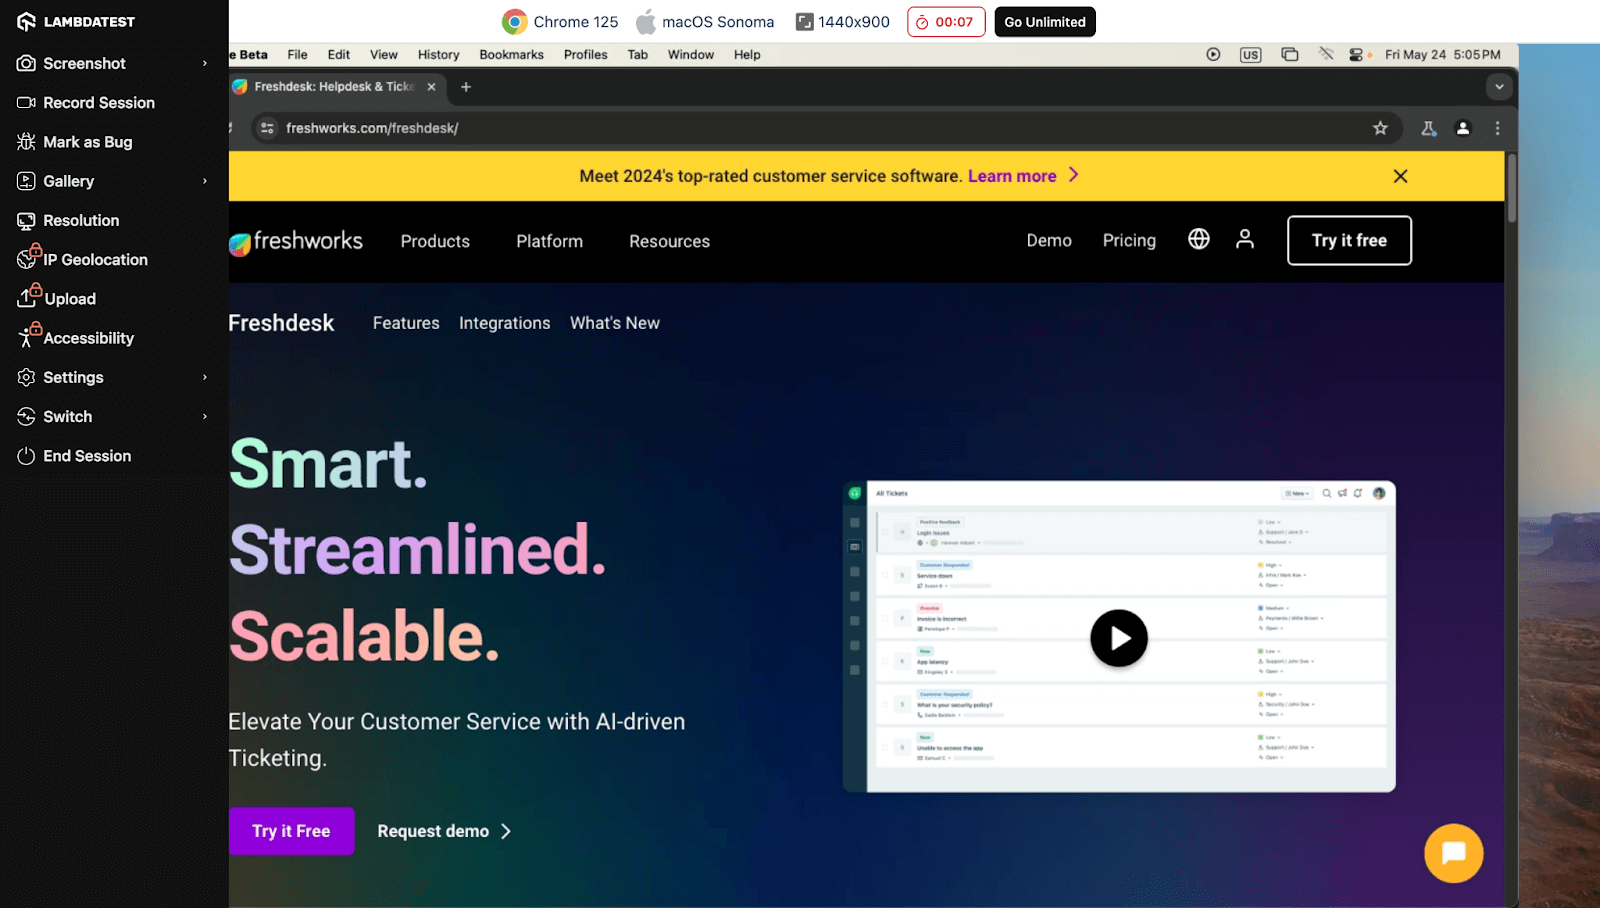
Step 6: Realtime Browser testing allows you to record the testing session, take relevant screenshots, create bug tickets, test your website with different geolocations, and many more capabilities.

This way using TestMu AI’s Realtime testing, one can Debug their HTML and fix them.
Conclusion
In web development, encountering visual discrepancies and compatibility hurdles is inevitable. However, Using effective debugging strategies and invaluable tools, developers can easily navigate these challenges. Each debugging technique is a cornerstone in the web development process, from addressing syntactical errors to ensuring cross-browser compatibility and rectifying misalignment issues.
By embracing these methodologies and leveraging powerful tools like TestMu AI Realtime Browser testing, W3C Validator Service, CSS Lint, and browser extensions, developers can streamline their workflows and elevate the quality of their code. Whether it’s outlining elements, toggling styles, or optimizing display types, meticulous attention to detail and a proactive approach to debugging are essential for crafting visually appealing, well-structured, and cross-compatible websites.
For those looking to dive deeper, resources like the “Top 90+ HTML Interview Questions and Answers ” can be invaluable. So, as you embark on your next web development journey, remember to harness the power of effective debugging techniques.
Debug HTML with TestMu AI’s Realtime Browser Testing
Conclusion
Frequently asked questions
Did you find this page helpful?
More Related Hubs
TestMu AI forEnterprise
Get access to solutions built on Enterprise
grade security, privacy, & compliance
- Advanced access controls
- Advanced data retention rules
- Advanced Local Testing
- Premium Support options
- Early access to beta features
- Private Slack Channel
- Unlimited Manual Accessibility DevTools Tests