
Next-Gen App & Browser Testing Cloud
Trusted by 2 Mn+ QAs & Devs to accelerate their release cycles

March’25 Updates: iOS VoiceOver Support, New KaneAI Features, and More!
Unlock our March product updates with iOS VoiceOver support, new features in KaneAI, SmartUI, and more to supercharge your testing speed, accuracy, and visibility.

Salman Khan
January 27, 2026
What’s new since our last round of updates?
A whole lot, actually 😀
Here’s a quick look at some of the latest features we’ve rolled out to elevate your testing experience.
VoiceOver Support on Real iOS Devices
You can now use VoiceOver on real iOS devices to manually test the accessibility of your mobile apps.
This helps you understand how your mobile app works for users who rely on screen readers—especially those with visual impairments. It lets you check if the content is readable, navigation makes sense, and interactive elements are announced correctly.
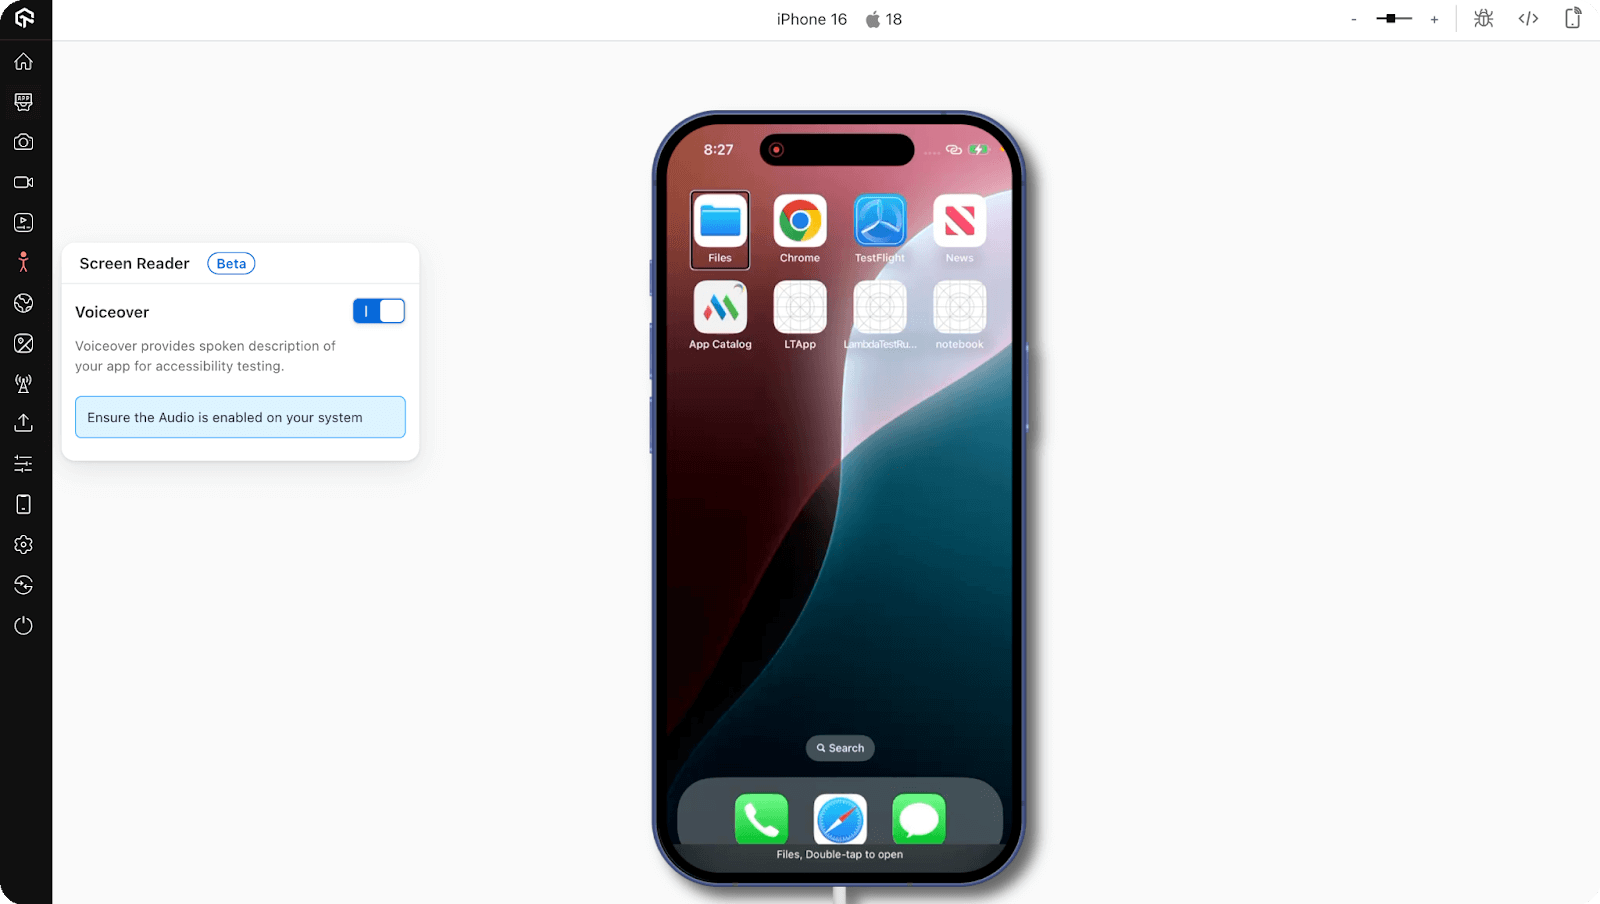
To begin with, head over to this guide on Screen Reader (VoiceOver) on iOS Devices.
New Feature Releases in KaneAI
We’ve added a bunch of new features to KaneAI to give you more control, flexibility, and ease during test creation and execution.
Change Your App While Editing Mobile Test Cases
Now, you can change or update the mobile app you’re testing right in the middle of editing a mobile test case in KaneAI. So, there is no need to start over from scratch for every new mobile app.
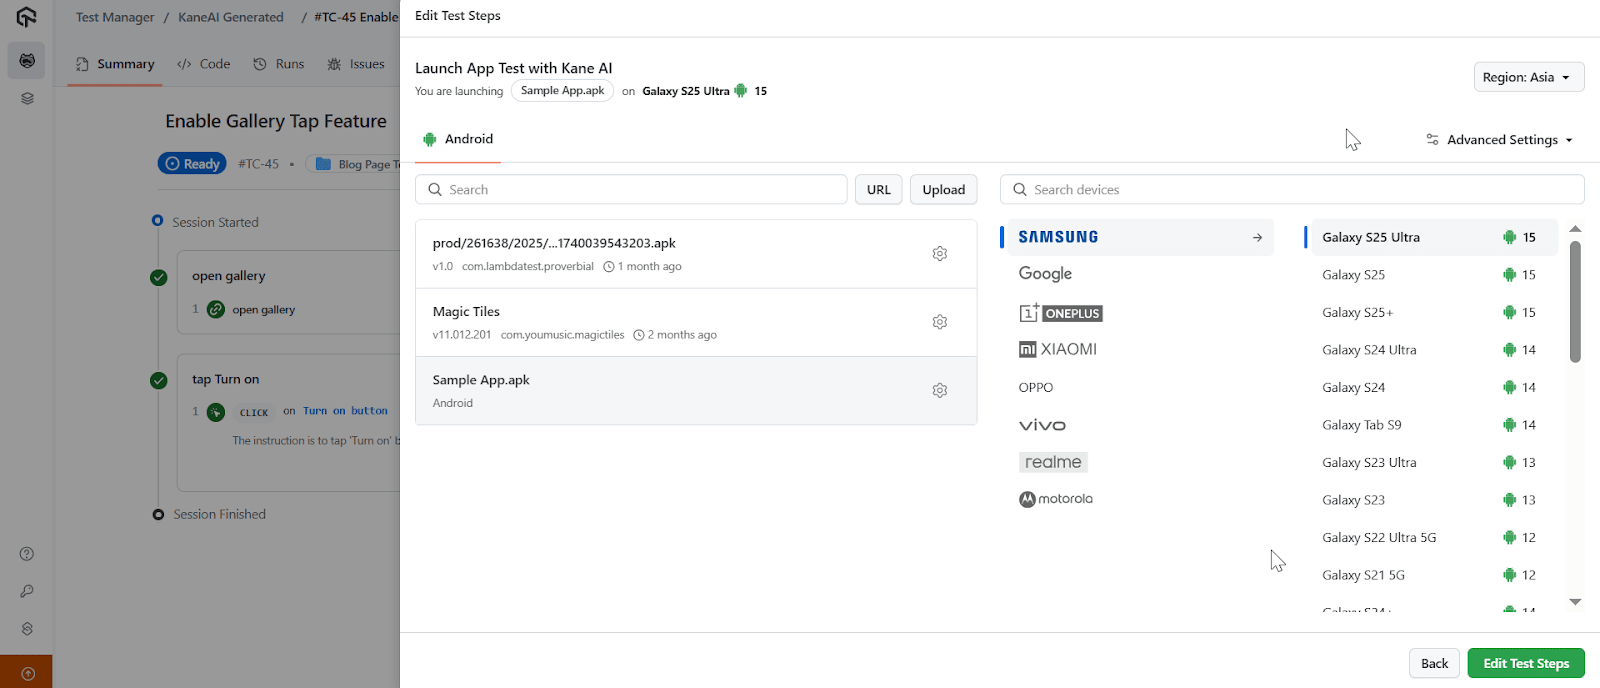
Let’s say you need to switch to a different version or configuration of your mobile app while working on a test case—you can do that without losing your progress. Your test steps will stay put and adjust to the new mobile app. Therefore, you don’t have to redo everything.
“Auto login through Google” Feature for Android Native App Automation
KaneAI now lets you log into a Google account on Android devices while creating native app test cases.
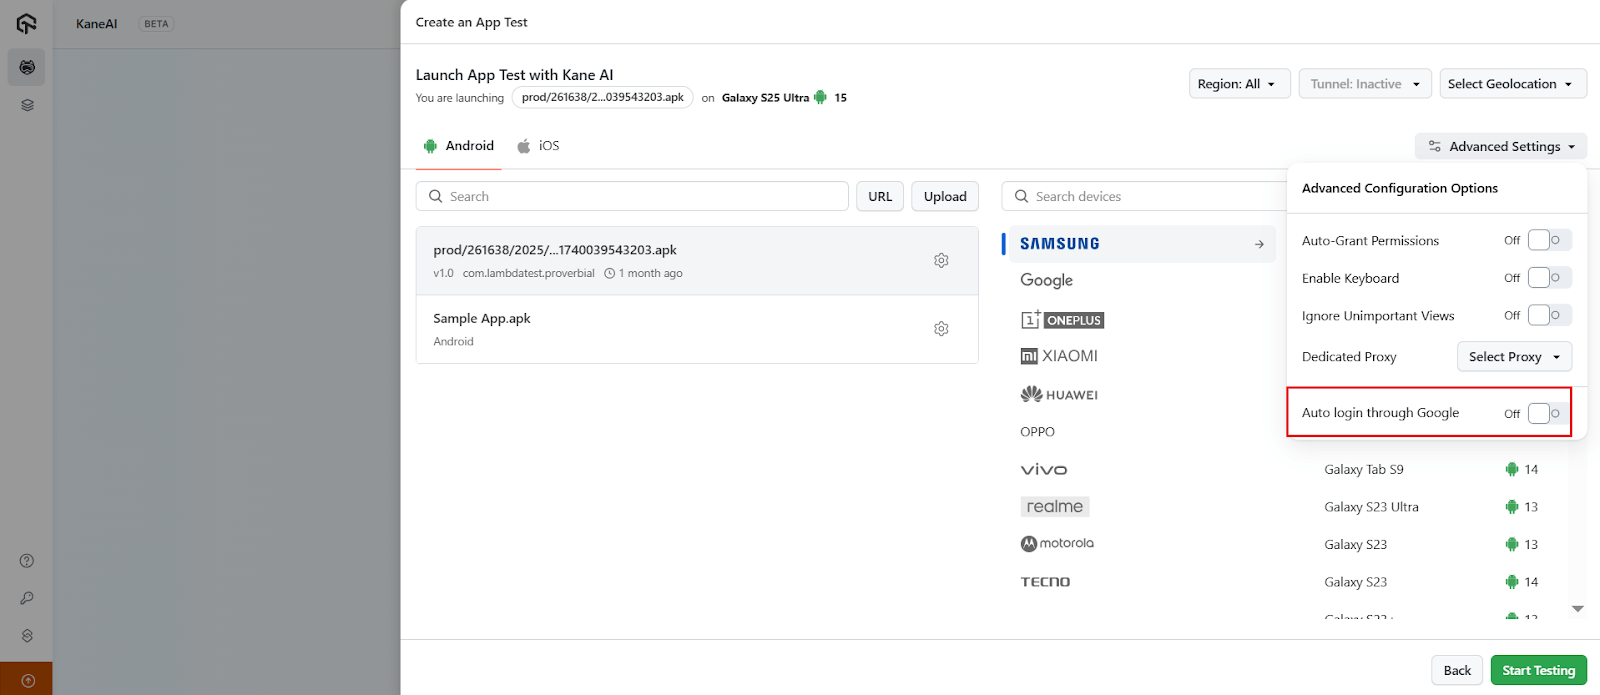
Using the Play Store login flow, you can sign in with your credentials—no Multi-Factor Authentication (MFA) is needed. This makes it easier to access and test Google-integrated apps during test creation while keeping things secure and efficient.
Debug Web Automated Tests With Network and Console Logs
You can now capture network and console logs in KaneAI while running web automation tests.
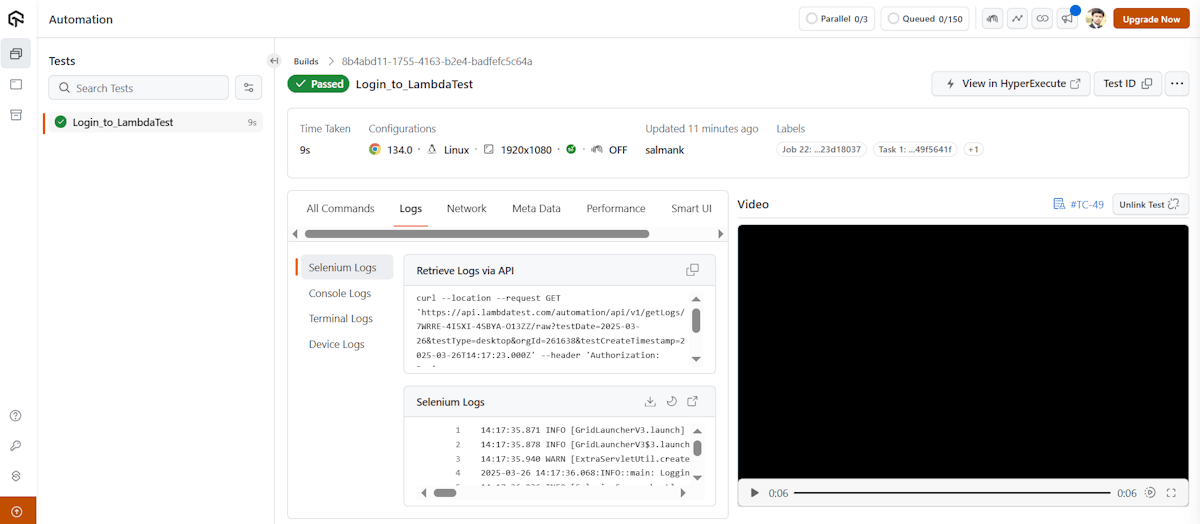
You’ll get detailed info like network requests, responses, browser errors, and JavaScript logs for debugging, checking API calls, and spotting what went wrong in your test.
These logs are saved and ready for you after the test run, giving you better visibility into performance and failures.
Run Web Tests With Chrome Options Support
You can now set Chrome browser options before starting a web test in KaneAI. This lets you set things like headless mode, disable extensions, or block pop-ups.
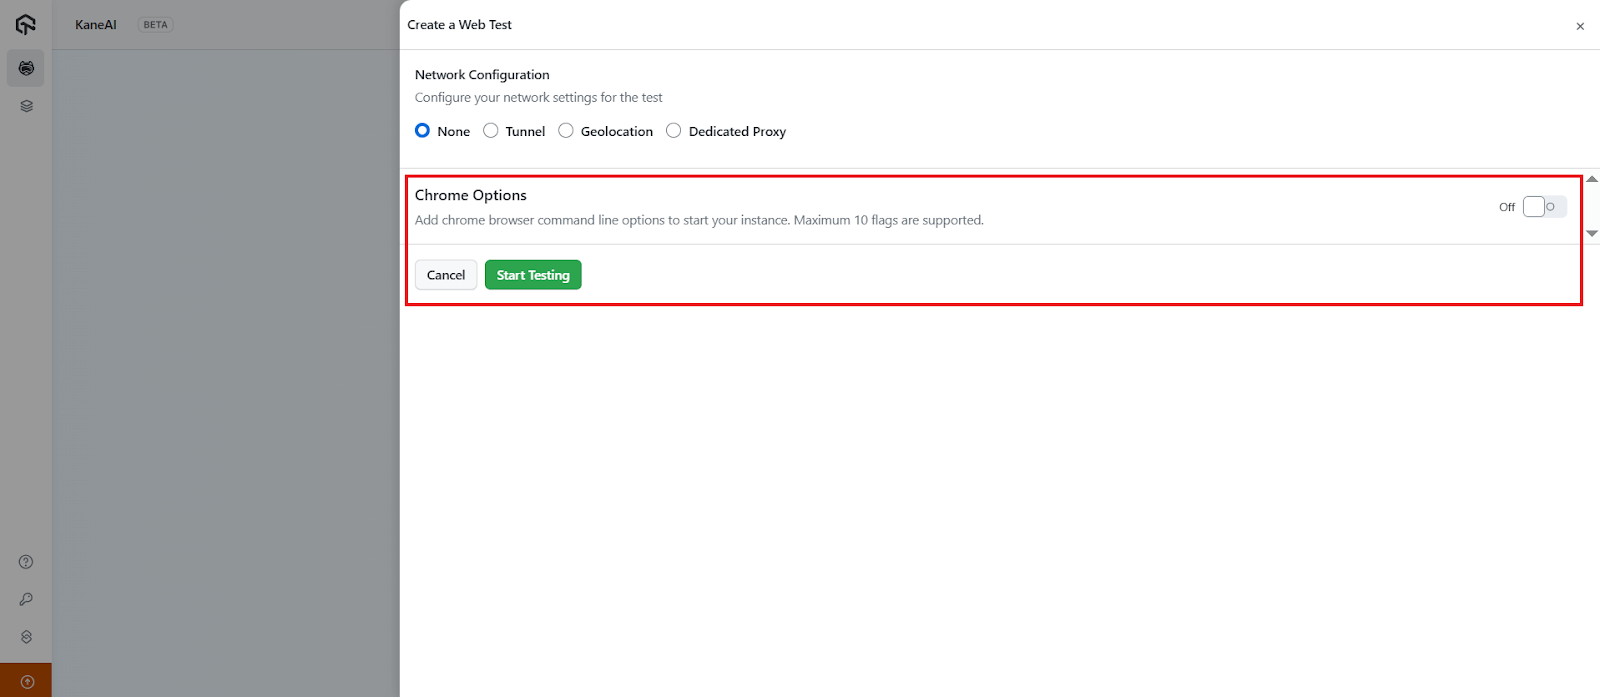
This is useful if you’re testing features that rely on specific browser settings or want to make tests run faster by disabling unnecessary features.
Replace URL for Test Runs Across Different Environments
You can now run the same test case across staging or production without editing your script. Just set up dynamic URL replacement in KaneAI, and it will update the environment link automatically during test runs.
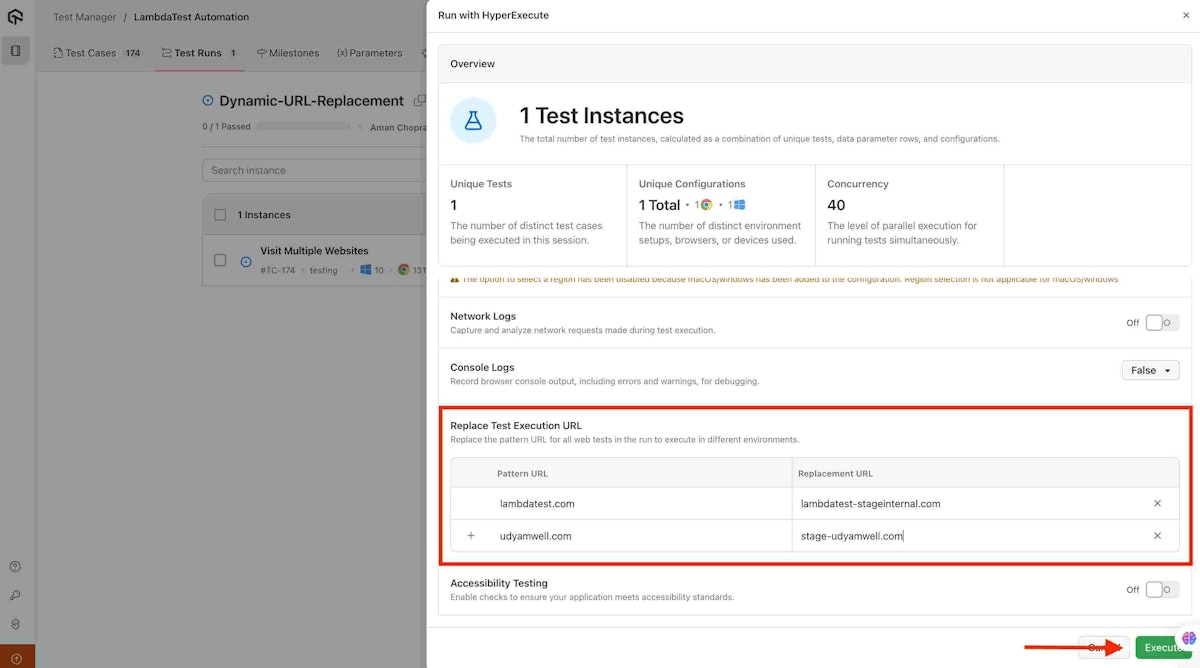
This helps avoid mistakes from manual edits and saves time when testing across multiple environments. It’s especially useful when you’re validating the same flow in different builds or need to quickly switch between environments without duplicating or rewriting test cases.
Use Smart Implicit Waits for Managing Network Requests
KaneAI now supports smart implicit waits that automatically pause the test for network activity to complete. You don’t need to manually add waits or guess the right delay anymore.
The test will continue only when the network response is ready. This reduces flakiness and improves overall test speed. It’s helpful when dealing with web pages that load content asynchronously or when network delays are common.
Run KaneAI Tests With TestMu AI Tunnel
You can now run tests on local or private environments using TestMu AI Tunnel in KaneAI. Just select a tunnel during test execution—whether through the UI or API—and KaneAI will connect to your local setup.
This means you can test websites or mobile apps that aren’t publicly available without exposing them online. It’s useful for testing development builds, staging servers, or behind a firewall.
Test Firebase Mobile Apps on Real Devices
You can now integrate your Firebase App Distribution account directly to TestMu AI and instantly push apps to real Android and iOS devices in the cloud.
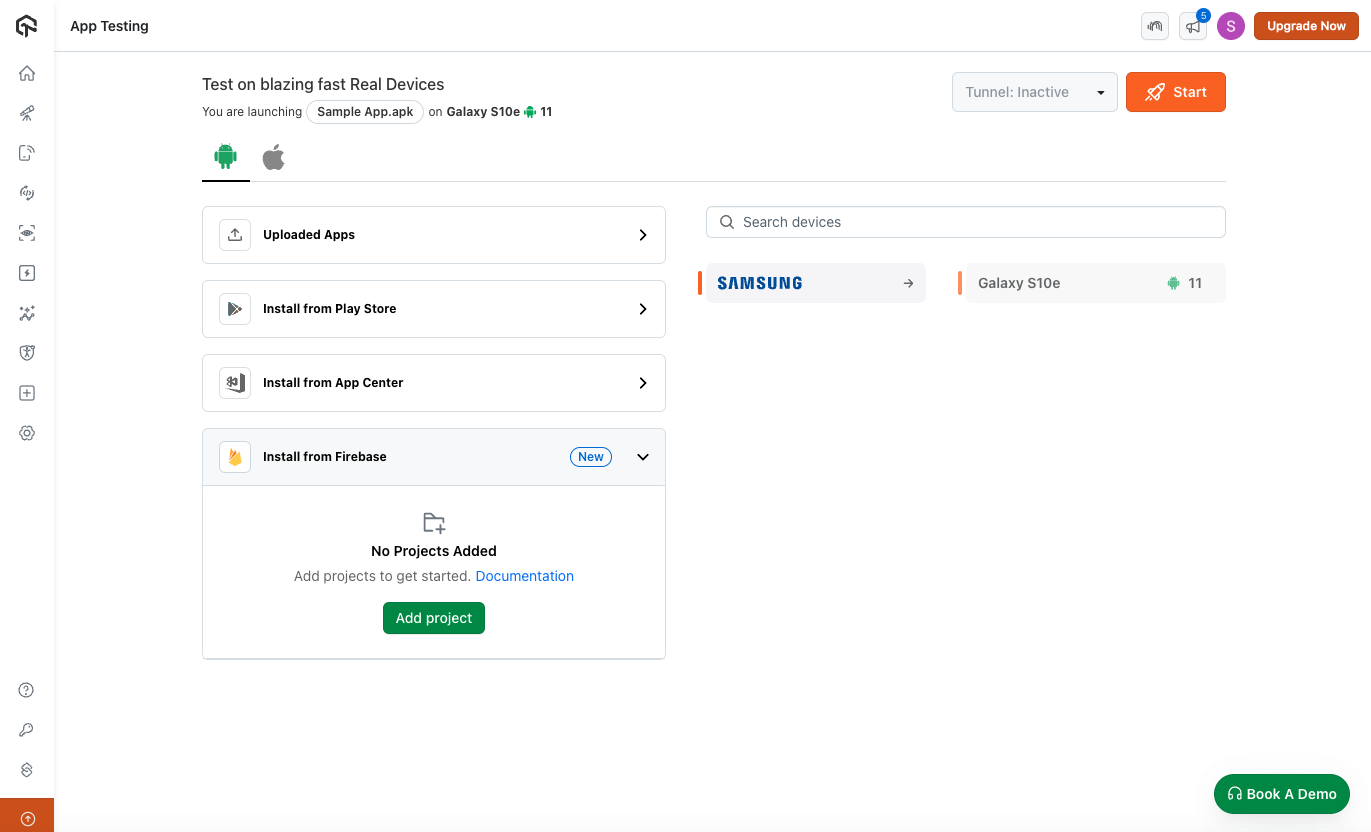
No more downloading and re-uploading builds—just link your Firebase project, and your mobile app is ready to test. It’s a faster way to test beta builds, bug fixes, or new features on actual devices without the back-and-forth.
Also, you can easily share your Firebase apps with teammates so everyone’s testing from the same source.
Refer to this documentation on how to test apps installed via Firebase.
Latest Releases in SmartUI
SmartUI just got a lot more powerful—now supporting DOM-level controls, XCUITest for iOS, and much more.
Draw Regions and Use DOM-Based Ignore/Select in SmartIgnore
You now have greater control over what parts of your web application get checked during visual testing. With the new region drawing tool in SmartIgnore, you can manually define specific areas to test. It is helpful when only certain sections of the UI are relevant to your test case.
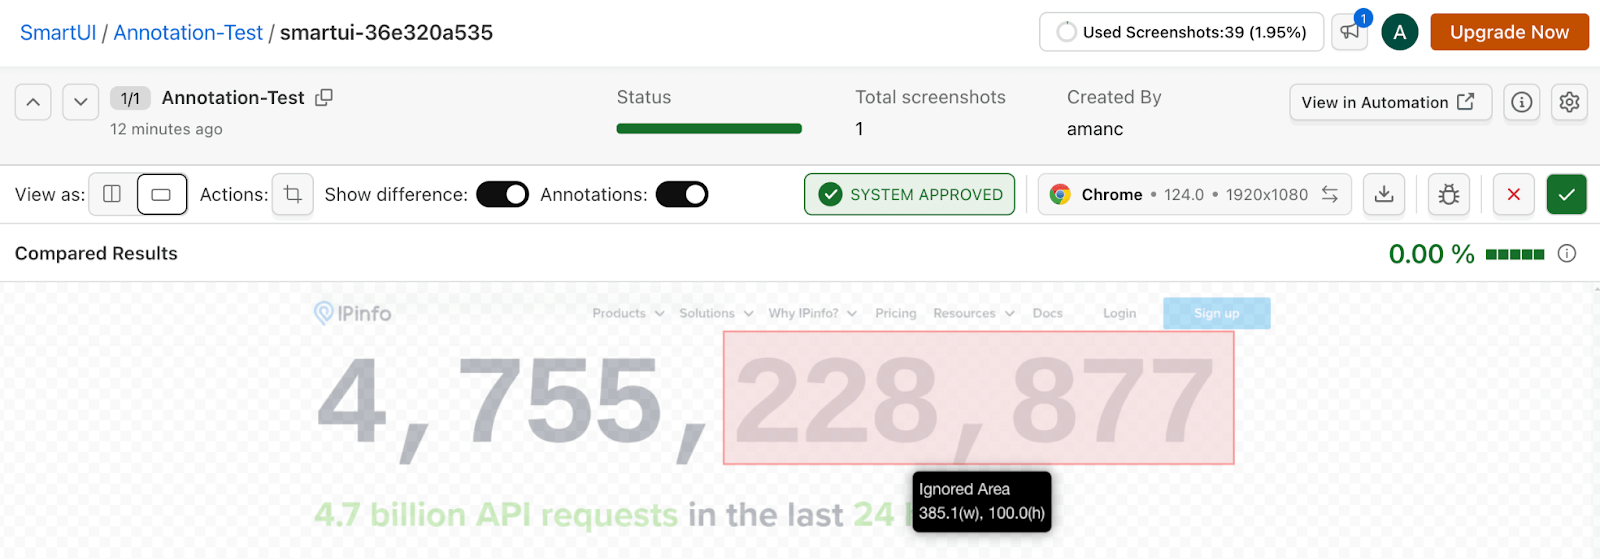
You can also ignore or select annotated regions by targeting DOM elements. For example, if any specific component, like dynamic banners or rotating ads, is constantly changing, you can exclude them from the comparison. This reduces false positives and helps focus your visual testing on the actual UI changes that matter.
SmartUI Capabilities Support for Selenium SDKs
If you run Selenium tests using Java or JavaScript, the SmartUI SDK now supports defining capabilities directly within the SDK itself. You can set browser versions, OS configurations, resolution settings, and more—all from your test script.
The SmartUI SDK capabilities remove the need to maintain separate configuration files or override them externally. It streamlines how you set up your Selenium tests and ensures that the visual regression suite runs exactly how you expect in different test environments.
Use Exec Commands in SmartUI CLI for Snapshot Server Management
The SmartUI CLI Exec commands allow you to manage the SmartUI snapshot server more easily. You can now start, stop, and check the status of the snapshot server directly from the command line—no need to manually open a separate process or check logs elsewhere.
This is useful when you need to control when and how the snapshot server runs in your automation pipeline or during local debugging. It gives you more operational control and helps reduce test flakiness caused by mismanaged server states.
Test Native Apps With Appium Using SmartUI App SDK
The SmartUI App SDK now supports running visual regression tests with Appium Java on real devices. You don’t need to rely on screenshots captured manually—this SDK automates the entire process.
You can also integrate SmartUI App SDK into your CI/CD workflows and test directly on any supported cloud platform, including TestMu AI.
Run Mobile Visual Tests With XCUITest Framework
You can perform mobile visual testing with XCUITest with SmartUI. It lets you automate visual regression tests for iOS apps using the native iOS test framework. You can capture snapshots during test runs and compare them against baselines to catch unwanted UI changes, all while continuing to work in the XCUITest ecosystem.
Run Visual Tests Using SmartUI SDK With Tunnel
You can use SmartUI SDK with Tunnel to test apps running in local, private, or staging environments. This is particularly useful when your application isn’t exposed to the public internet but still needs visual validation.
Just start a secure tunnel from your local machine or test environment and run your visual regression tests like you normally would. You’ll be able to catch layout issues or broken styles in isolated environments before deploying to production—without compromising security.
Latest Enhancements in HyperExecute
We’ve also made some key enhancements to HyperExecute. Here’s a quick look at what’s new:
- Parameterize Appium Flag for iOS Simulation on Desktop Browsers: You can now control iOS simulation behavior on desktop browsers by setting a parameterized appium flag. This lets you toggle simulation based on test requirements without altering the script. It brings more flexibility to cross-platform testing setups.
- Use the reporterConfigFile Option in cypressOps for Custom Reporter Setup: Cypress users can now specify a custom reporter configuration file using the reporterConfigFile option in cypressOps. This allows you to plug in advanced reporting tools with minimal setup.
- Run .NET Tests Using the runtime Flag With Versions 4.7 and 4.8: You can now run .NET tests by specifying the runtime flag for versions 4.7 and 4.8.
- Define Project Name and Auto Create Project With projectName Capability: The projectName capability lets you define and auto-create projects directly from your test configuration. No need for manual project setup each time.
- Generate Consolidated Native Robot Test Reports: HyperExecute now supports consolidated reporting for native Robot Framework test runs. Instead of navigating through multiple logs, you get a single, unified report. This makes analysis faster and simplifies reporting for large test suites.
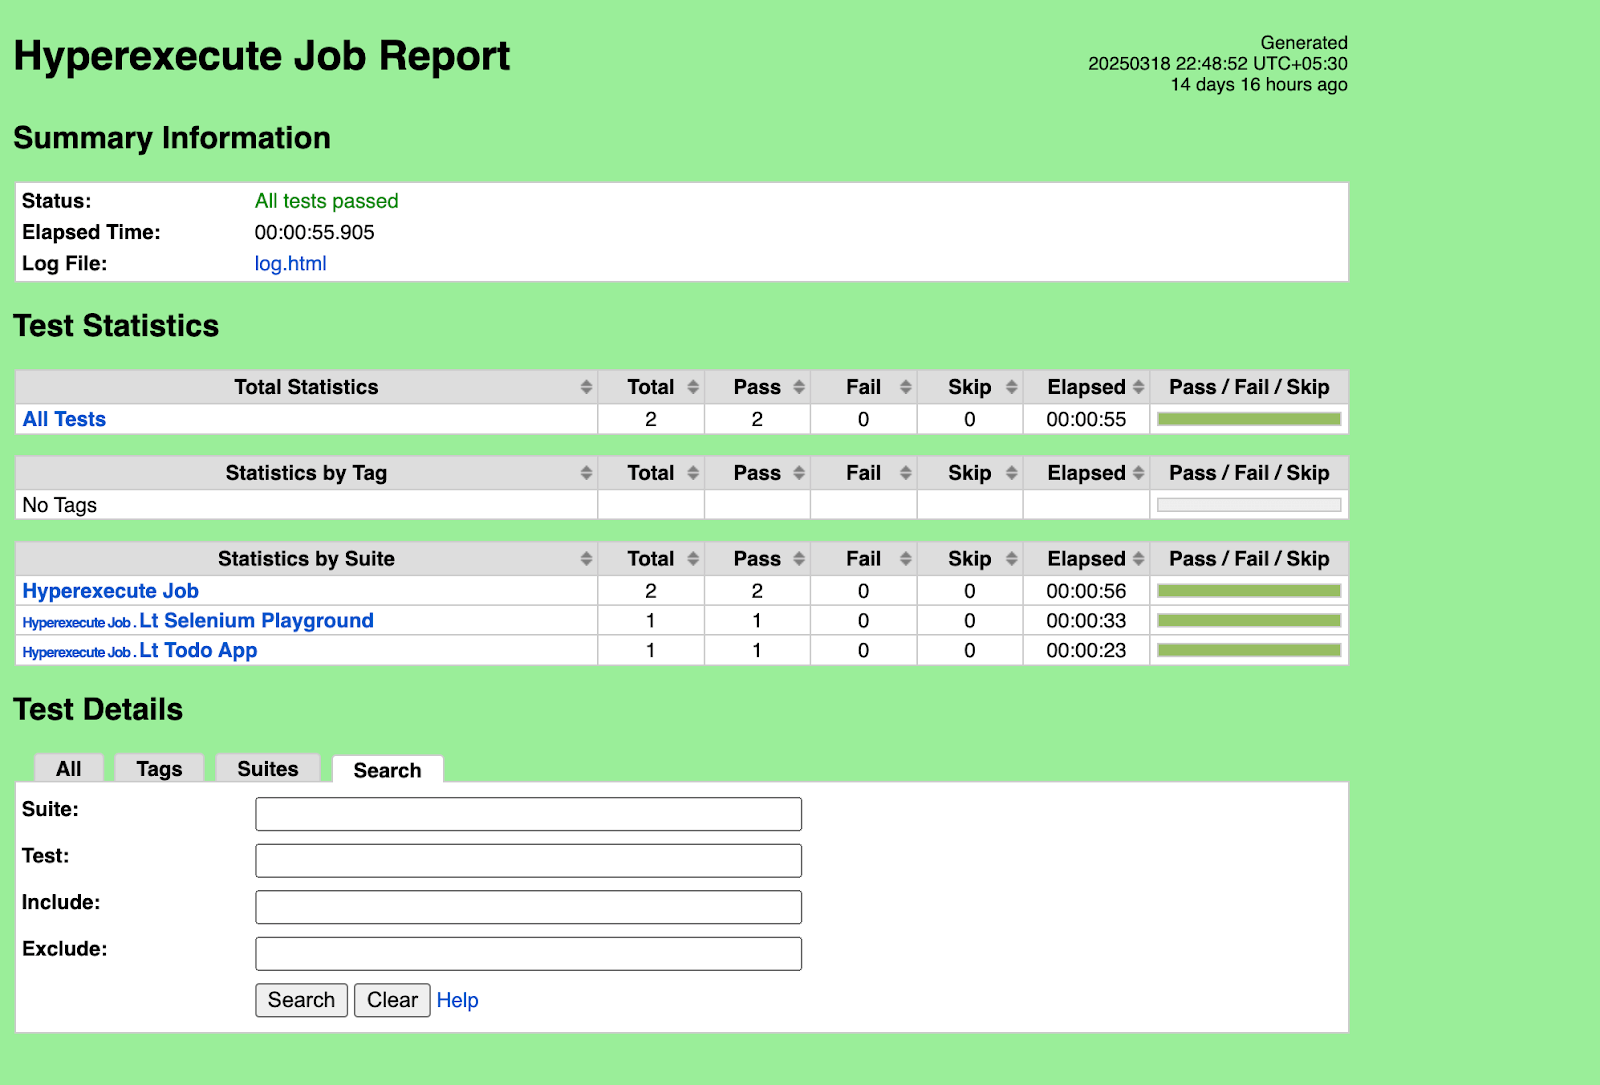
To get started, check out this documentation on HyperExecute.
Get Deeper Visibility With Private Desktop Insights
You can now access detailed analytics for your desktop testing with the new Private Desktop insights—now live in beta.
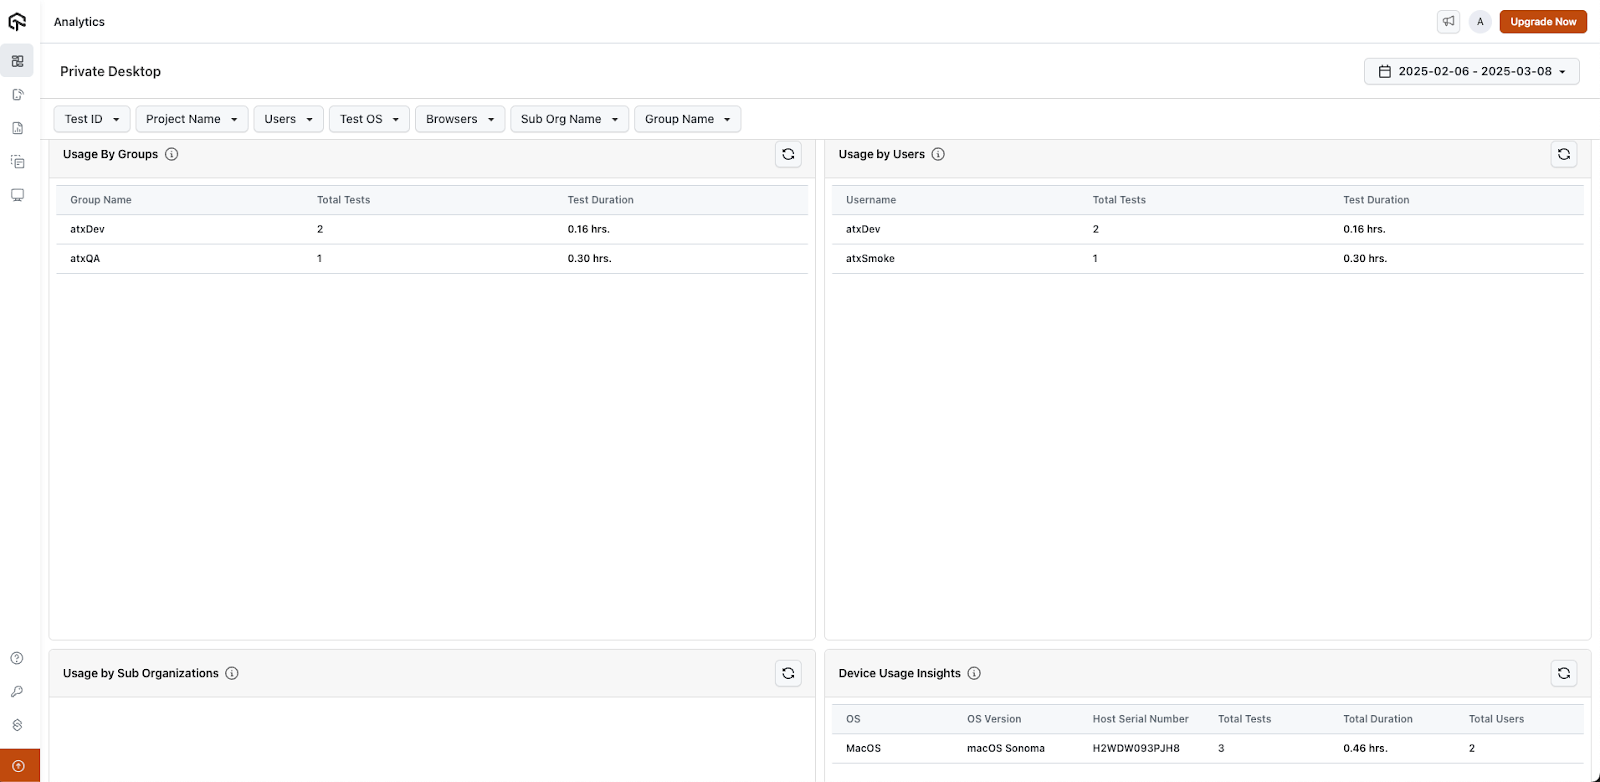
With this feature, you can track exactly how your test devices are being used: how many tests were run, how long devices were active, and which environments were used most.
You also get usage breakdowns by user, group, or sub-org—so you can easily spot trends, boost adoption, and plan smarter. Use filters like date, browser, OS, hostname, and more to slice the data however you need.
View, Schedule, and Download Reports in the Test Manager
We’ve introduced a new Reports feature in Test Manager to help you stay on top of your testing efforts with ease. You can now view, schedule, and download reports—all from one place.
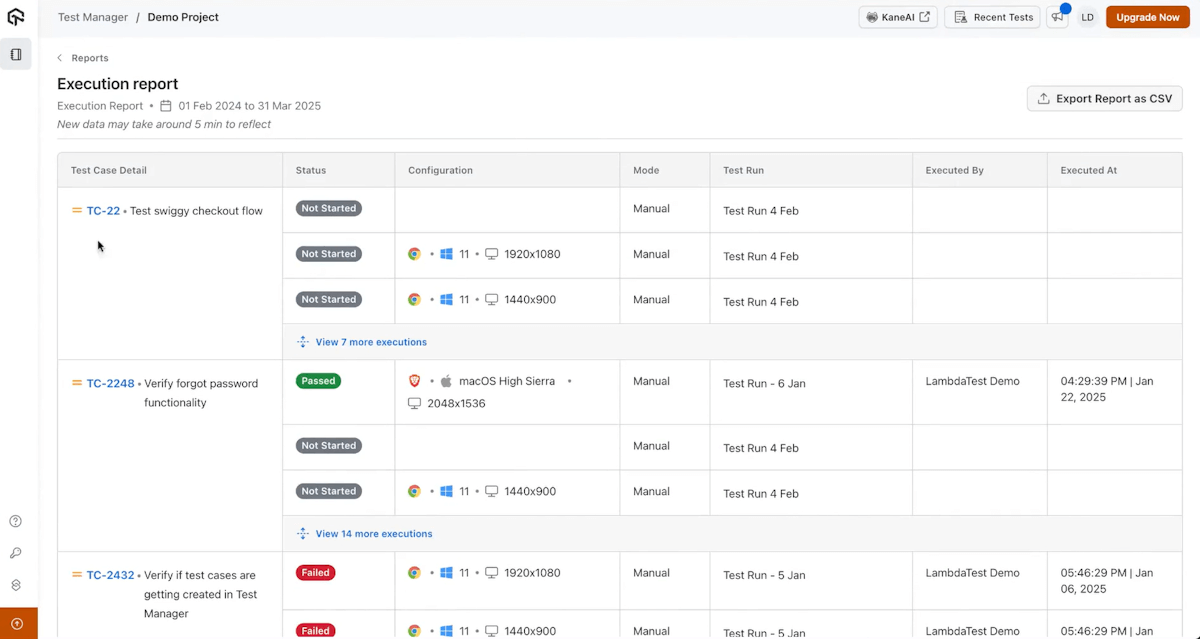
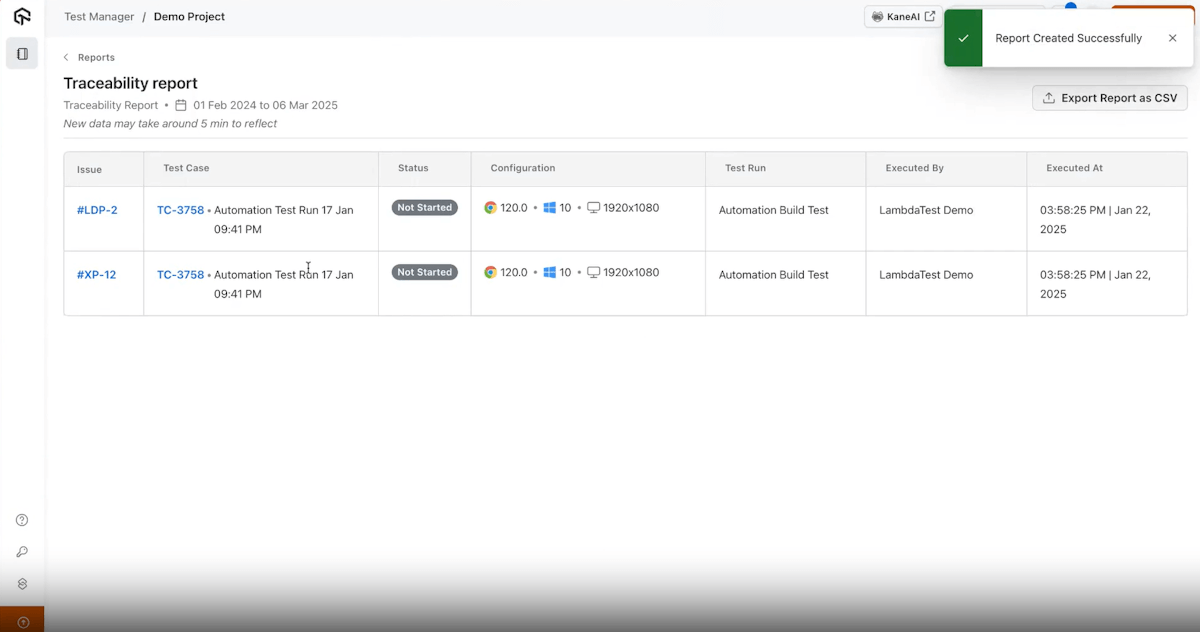
The Reports feature lets you generate two types of reports: Execution and Traceability.
Execution Report
With this report, you can track your test execution history in detail and see how your test runs are performing over time with data like:
- Number of passed/failed tests
- Test durations
- Execution trends across cycles
Traceability Report
With this report, you can gain end-to-end visibility by connecting test cases to their related:
- Requirements
- User stories
- Bugs and defects
To try it out, visit our getting started guide on Test Manager.
Summing Up!
Last month, we brought the heat with a fresh batch of features in KaneAI, SmartUI, and HyperExecute to level up your testing game.
Got feedback or feature ideas? Drop them in the TestMu AI Community—we’re all ears!
Did you find this page helpful?
More Related Hubs
TestMu AI forEnterprise
Get access to solutions built on Enterprise
grade security, privacy, & compliance
- Advanced access controls
- Advanced data retention rules
- Advanced Local Testing
- Premium Support options
- Early access to beta features
- Private Slack Channel
- Unlimited Manual Accessibility DevTools Tests
