Analytics Modules - Jobs & Tests Overview
HyperExecute Analytics
The HyperExecute Analytics module empowers QA managers to gain comprehensive insights into their HyperExecute testing pipeline. This module provides a centralized view of all the key metrics related to jobs, tasks, and stages executed on the TestMu AI platform.
Job Trends
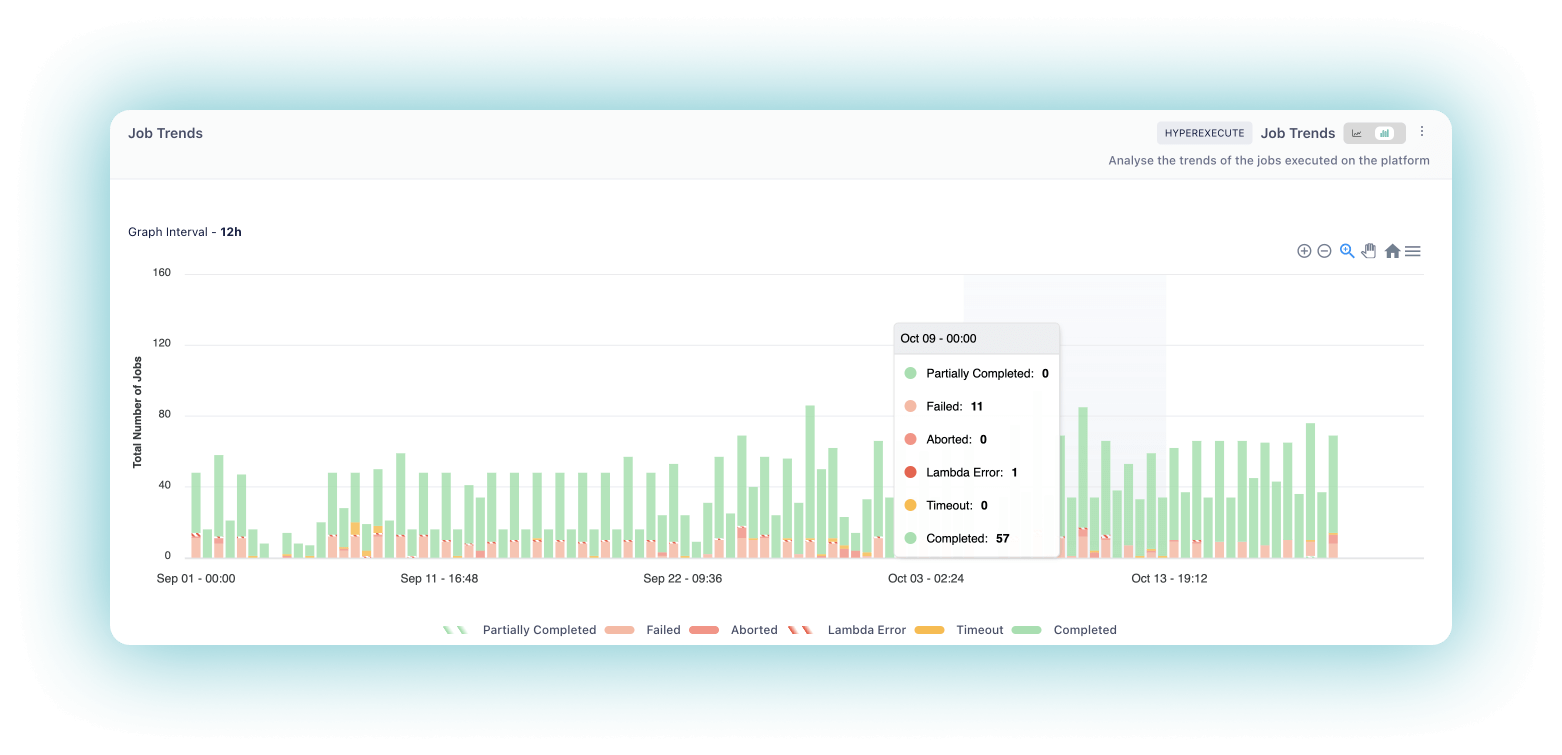
The Job Trends widget allows you to analyze the trends of jobs executed on the platform, categorized by their status: Failed, Aborted, Lambda Error, Timeout, and Completed. You can easily filter the data using the legends at the top of the graph.
- X-Axis: Represents the time intervals at which the job trends are measured.
- Y-Axis: Represents the number of jobs categorized by their status.
How It Works
- The widget tracks the number of jobs and their respective statuses over a specified time period.
- It presents the job trends in a graph format, displaying the number of jobs for each status at each time interval.
- You can hover over specific data points to view the exact number of jobs for each status at that particular time.
Value Proposition
By examining the Job Trends widget, you can identify patterns, fluctuations, or anomalies in your job execution over time. This information helps you assess the stability and reliability of your HyperExecute testing pipeline, allowing you to proactively address any emerging issues and ensure the consistent quality of your jobs.
Use Case
As a QA Manager, John's team runs over 50,000 jobs per month across various TestMu AI products. With the Job Trends widget, John can:
- Understand the status distribution of jobs executed by his team.
- Identify any failing job numbers and troubleshoot them by viewing the logs.
Job Queue Time Trends
The Job Queue Time Trends widget provides a comprehensive view of the total queue time for all jobs in a visual format. It displays a stacked line or bar chart, with the total queue time for each job on the y-axis and the job number in descending order from right on the x-axis.
- X-Axis: Represents the job numbers in descending order.
- Y-Axis: Represents the total queue time for each job.
How It Works
- The widget calculates the total queue time for each job executed on the platform.
- It presents the queue time trends in a graph format, displaying the total queue time for each job.
- You can hover over specific data points to view the exact queue time for a particular job.
Value Proposition
By analyzing the Job Queue Time Trends widget, you can identify bottlenecks, optimize resource allocation, and minimize waiting times in your HyperExecute testing pipeline. This information helps you streamline your testing process, ensure efficient utilization of resources, and reduce overall execution time.
Use Cases
- Identify trends in queue time and investigate the causes behind fluctuations.
- Optimize resource allocation to reduce overall queue time.
- Monitor the impact of changes made to testing processes, infrastructure, or configurations.
- Compare performance over time by selecting different date ranges.
- Share insights with team members to foster collaboration and drive improvements.
Job Summary
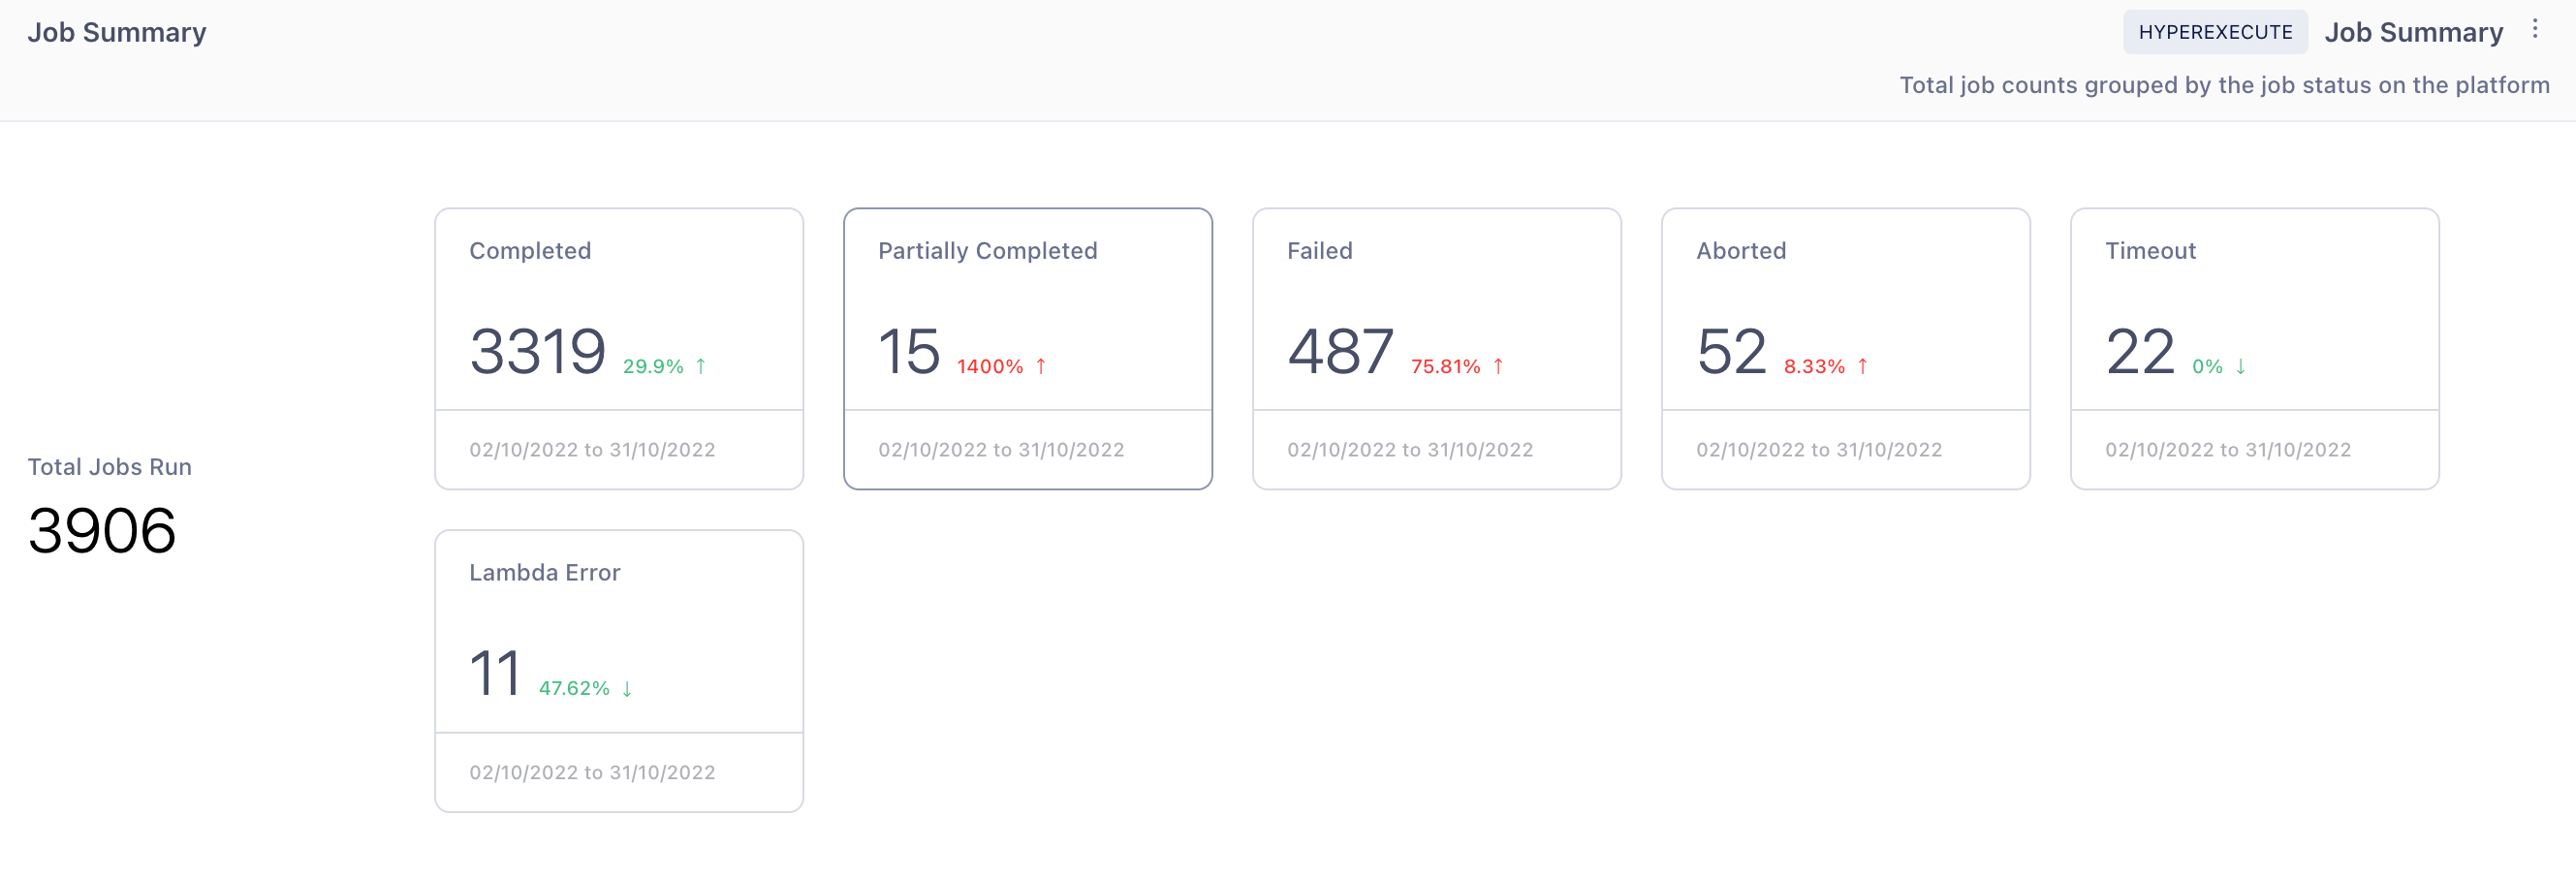
The Job Summary widget enables you to track the total number of jobs run on the platform, grouped by their status: Completed, Partially Completed, Failed, Aborted, etc.
How It Works
- The widget calculates the total number of jobs executed on the platform.
- It categorizes the jobs based on their status and provides a summary of the count for each status.
Value Proposition
The Job Summary widget gives you a high-level overview of the overall health and progress of your HyperExecute testing efforts. By monitoring the total count of jobs and their status distribution, you can assess the efficiency and effectiveness of your testing pipeline and identify areas that require attention or optimization.
Use Case
John can use the Job Summary widget to:
- Get a total count of jobs executed on the platform for a specific environment or status.
- Monitor the overall health and progress of his team's testing efforts.
Stage Summary
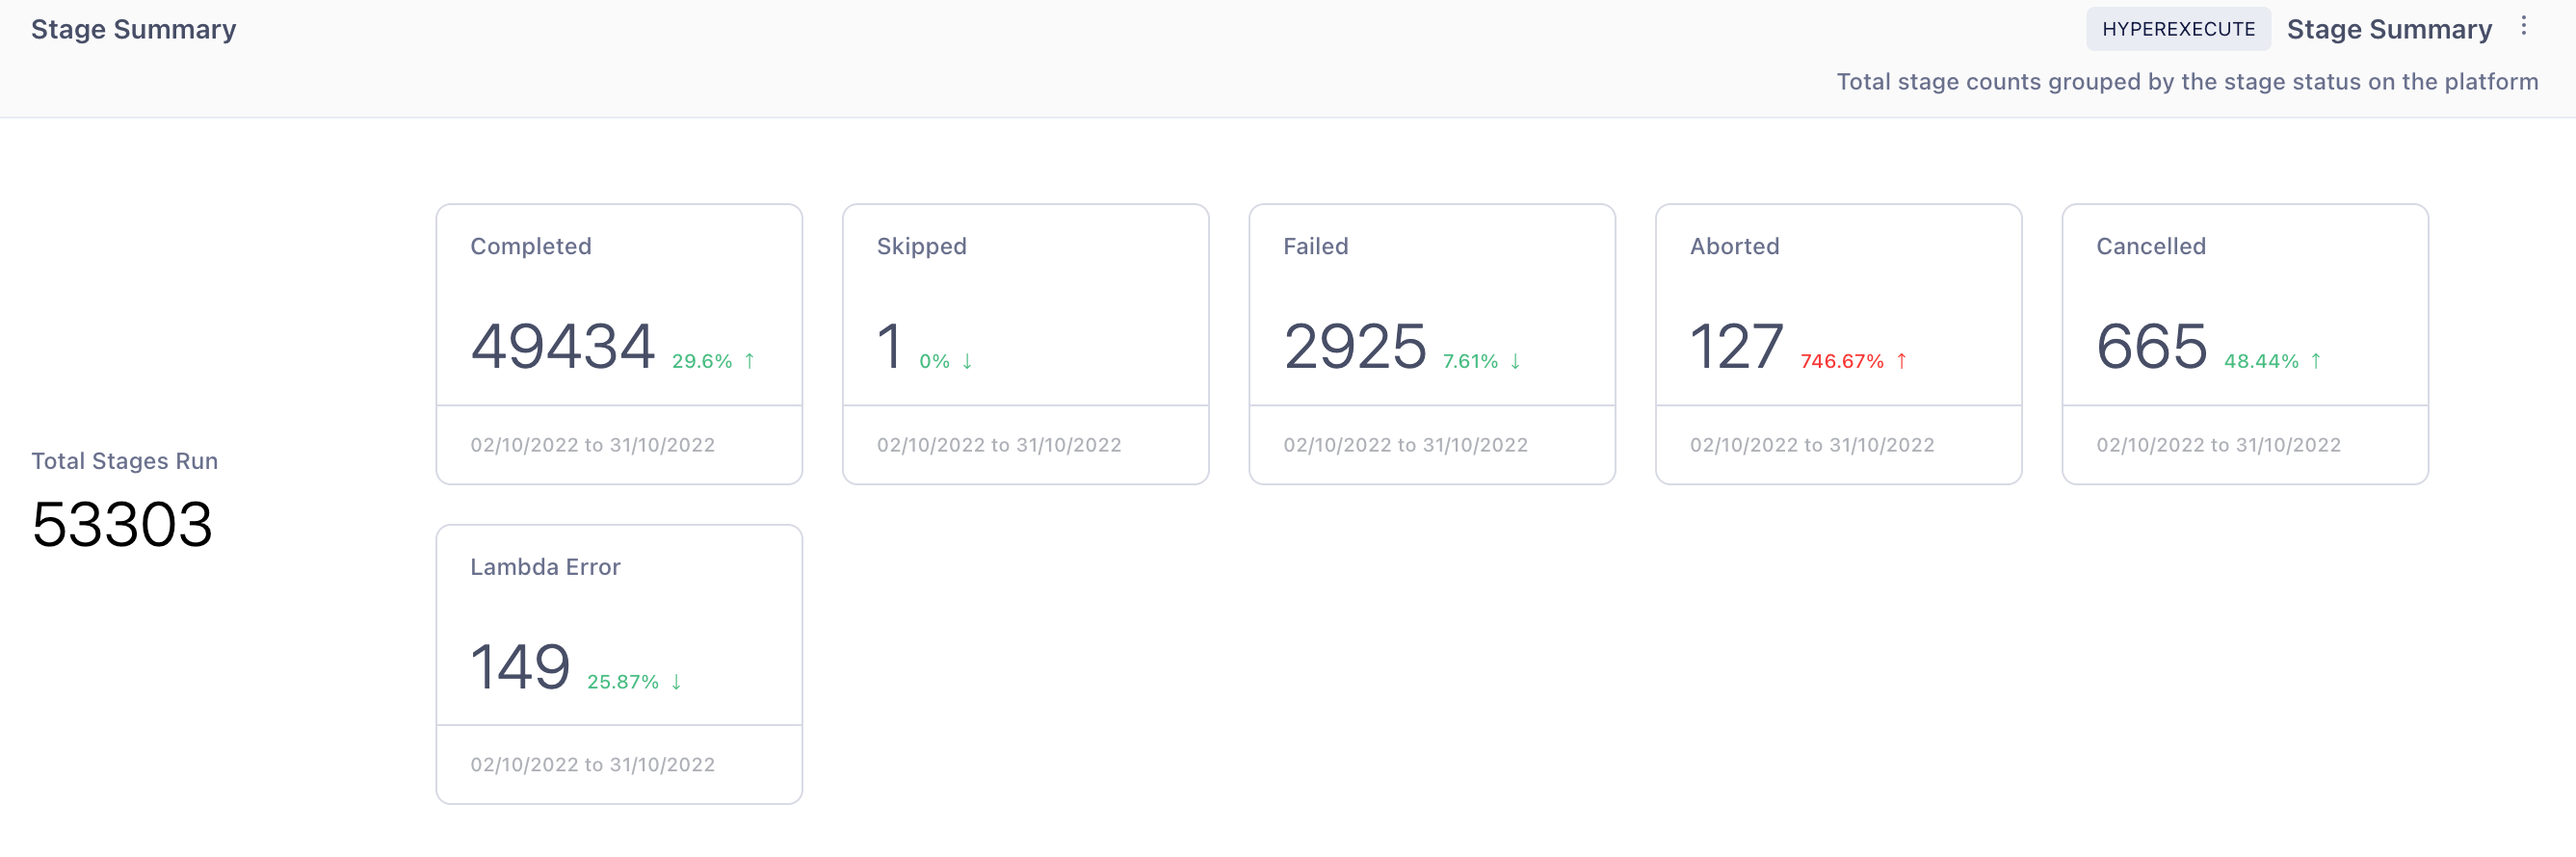
The Stage Summary widget allows you to track the total number of stages run on the platform, grouped by their status: Completed, Skipped, Failed, Aborted, etc.
How It Works
- The widget calculates the total number of stages executed on the platform.
- It categorizes the stages based on their status and provides a summary of the count for each status.
Value Proposition
The Stage Summary widget provides a granular view of the execution progress at the stage level. By monitoring the total count of stages and their status distribution, you can identify any bottlenecks, failures, or inefficiencies within specific stages of your HyperExecute testing pipeline. This information helps you focus your optimization efforts on the critical stages that require attention.
Use Case
John can use the Stage Summary widget to:
- Get a total count of stages executed on the platform for a specific environment or status.
- Identify any bottlenecks or issues at the stage level.
Stage Trends
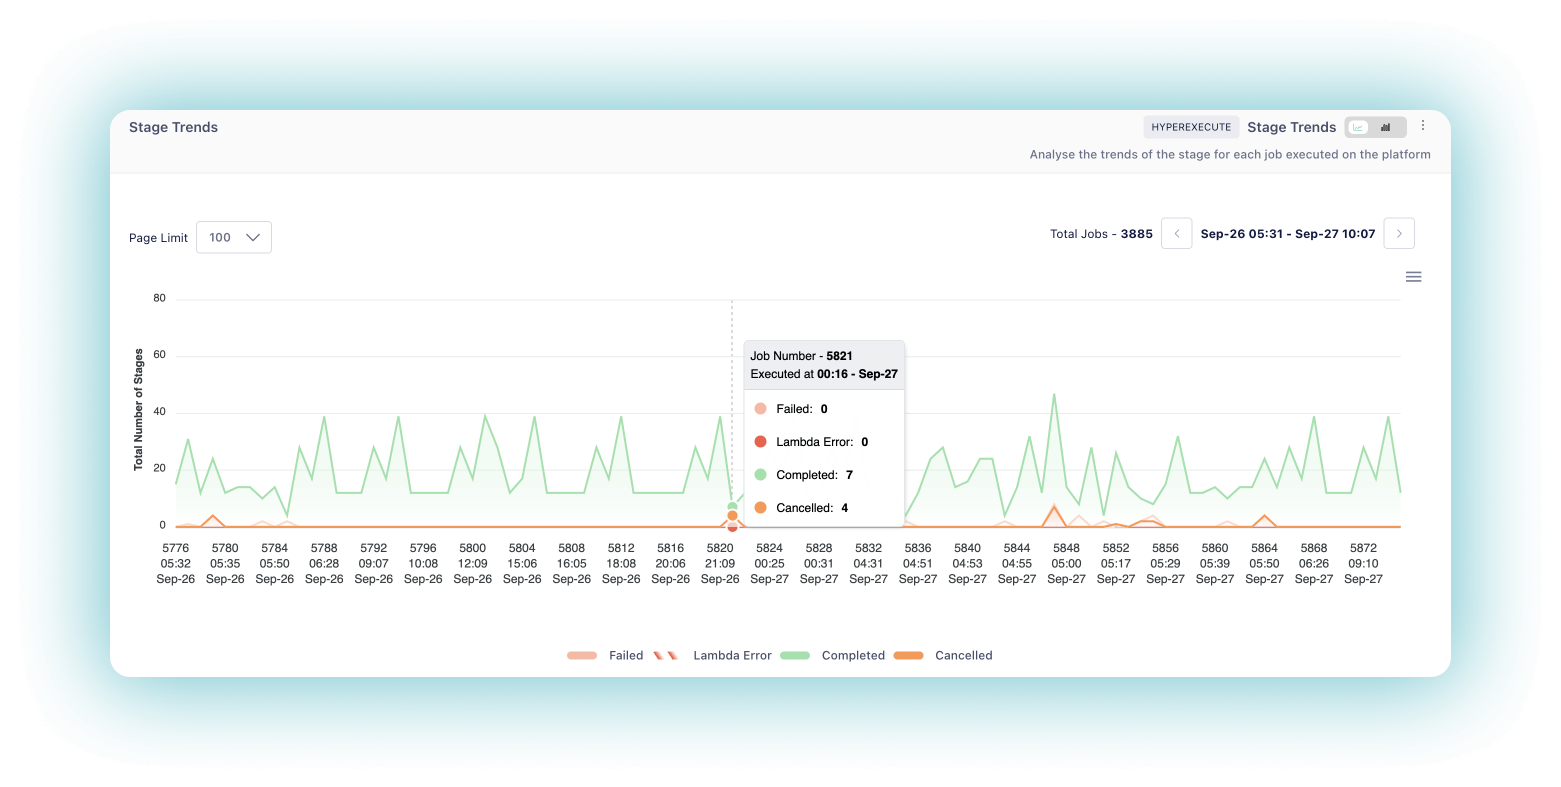
The Stage Trends widget enables you to analyze the trends of stages for each job executed on the platform, categorized into Completed, Failed, Lambda Error, and Cancelled. You can filter the data by a specific date and time.
- X-Axis: Represents the time intervals at which the stage trends are measured.
- Y-Axis: Represents the number of stages categorized by their status.
How It Works
- The widget tracks the number of stages and their respective statuses over a specified time period.
- It presents the stage trends in a graph format, displaying the number of stages for each status at each time interval.
- You can hover over specific data points to view the exact number of stages for each status at that particular time.
Value Proposition
By examining the Stage Trends widget, you can identify patterns, fluctuations, or anomalies in your stage execution over time. This information helps you assess the stability and reliability of specific stages within your HyperExecute testing pipeline, allowing you to proactively address any emerging issues and ensure the consistent quality of your stages.
Use Case
John can use the Stage Trends widget to:
- Understand the status distribution of stages in the jobs executed by his team.
- Identify any failing stages and gather information for troubleshooting.
Task Summary
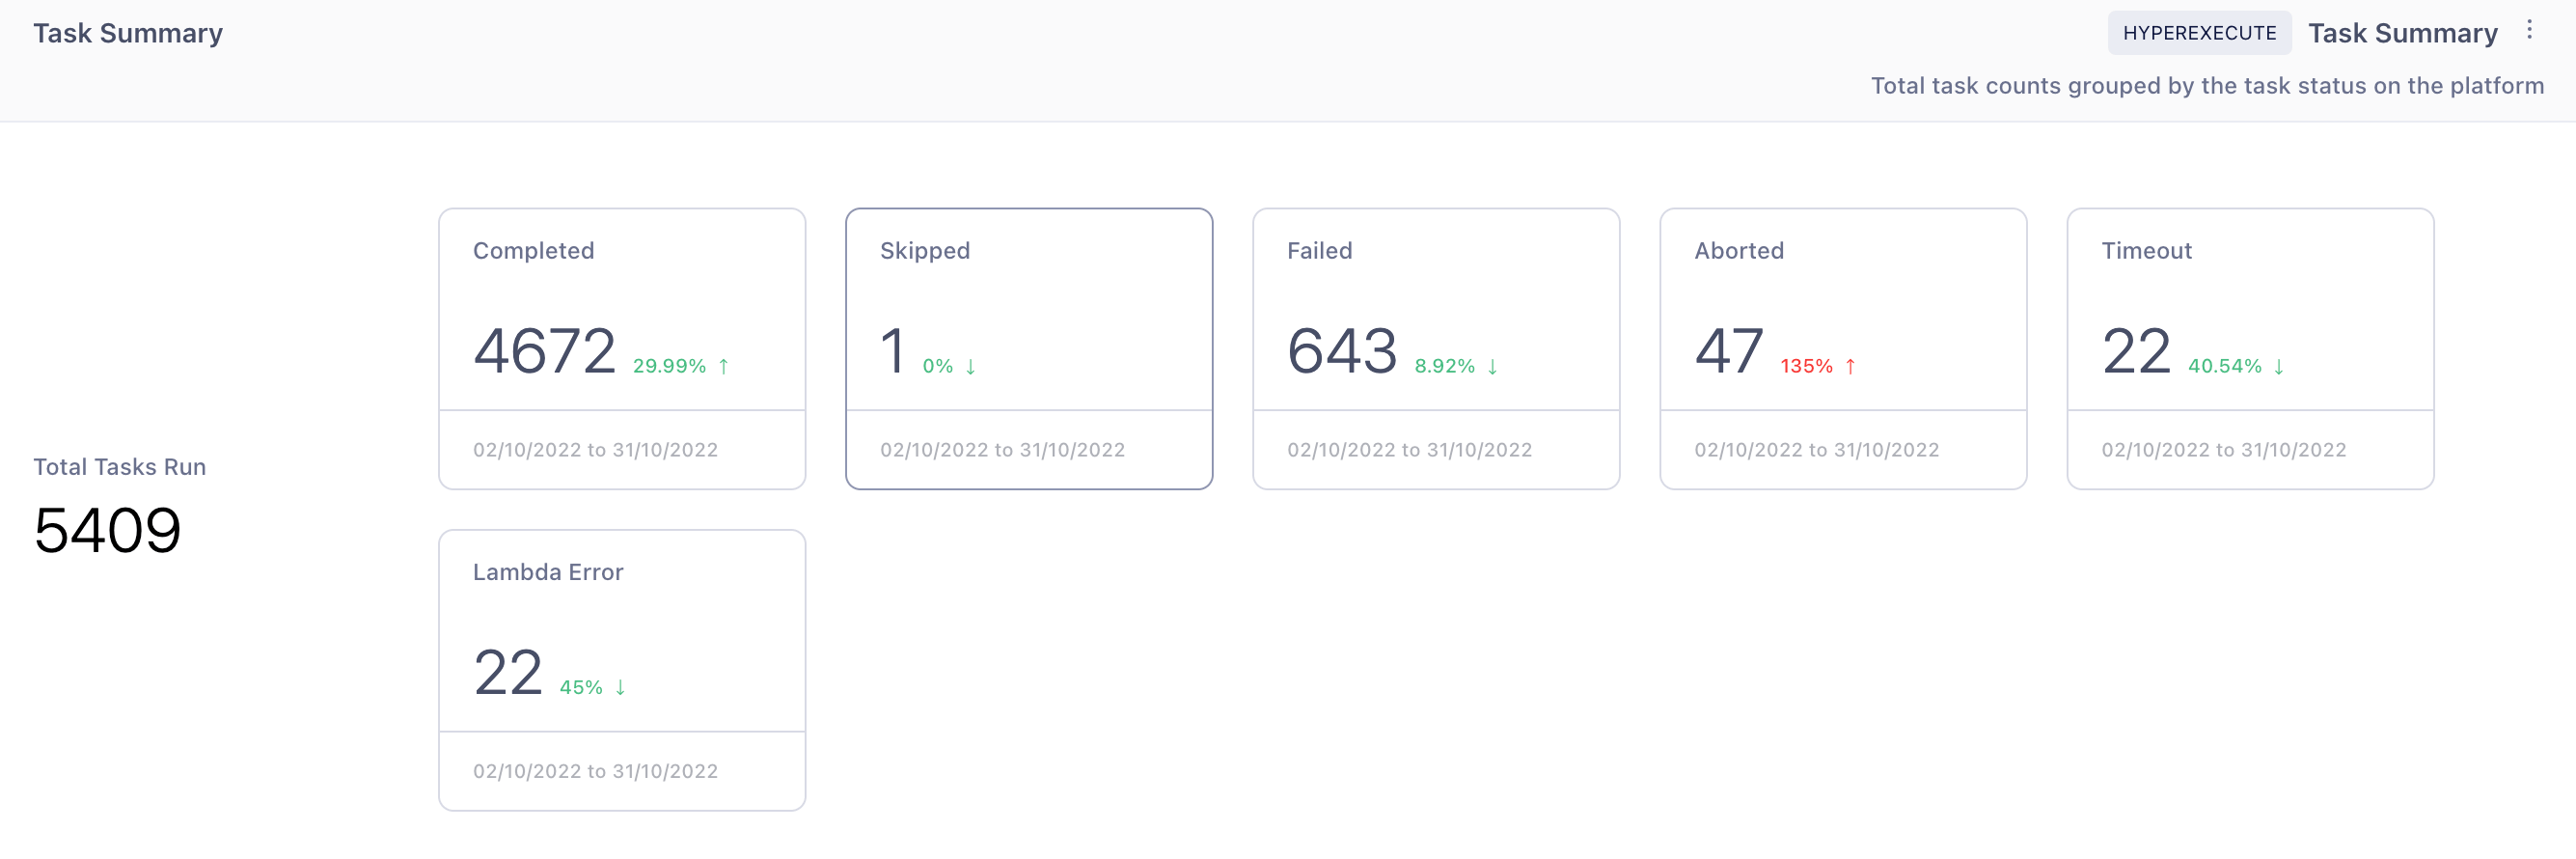
The Task Summary widget allows you to track the total number of tasks run on the platform, grouped by their status: Completed, Skipped, Failed, Aborted, etc.
How It Works
- The widget calculates the total number of tasks executed on the platform.
- It categorizes the tasks based on their status and provides a summary of the count for each status.
Value Proposition
The Task Summary widget provides a granular view of the execution progress at the task level. By monitoring the total count of tasks and their status distribution, you can identify any bottlenecks, failures, or inefficiencies within specific tasks of your HyperExecute testing pipeline. This information helps you focus your optimization efforts on the critical tasks that require attention.
Use Case
John can use the Task Summary widget to:
- Get a total count of tasks executed on the platform for a specific environment or status.
- Monitor the granular progress of his team's testing efforts.
Task Trends
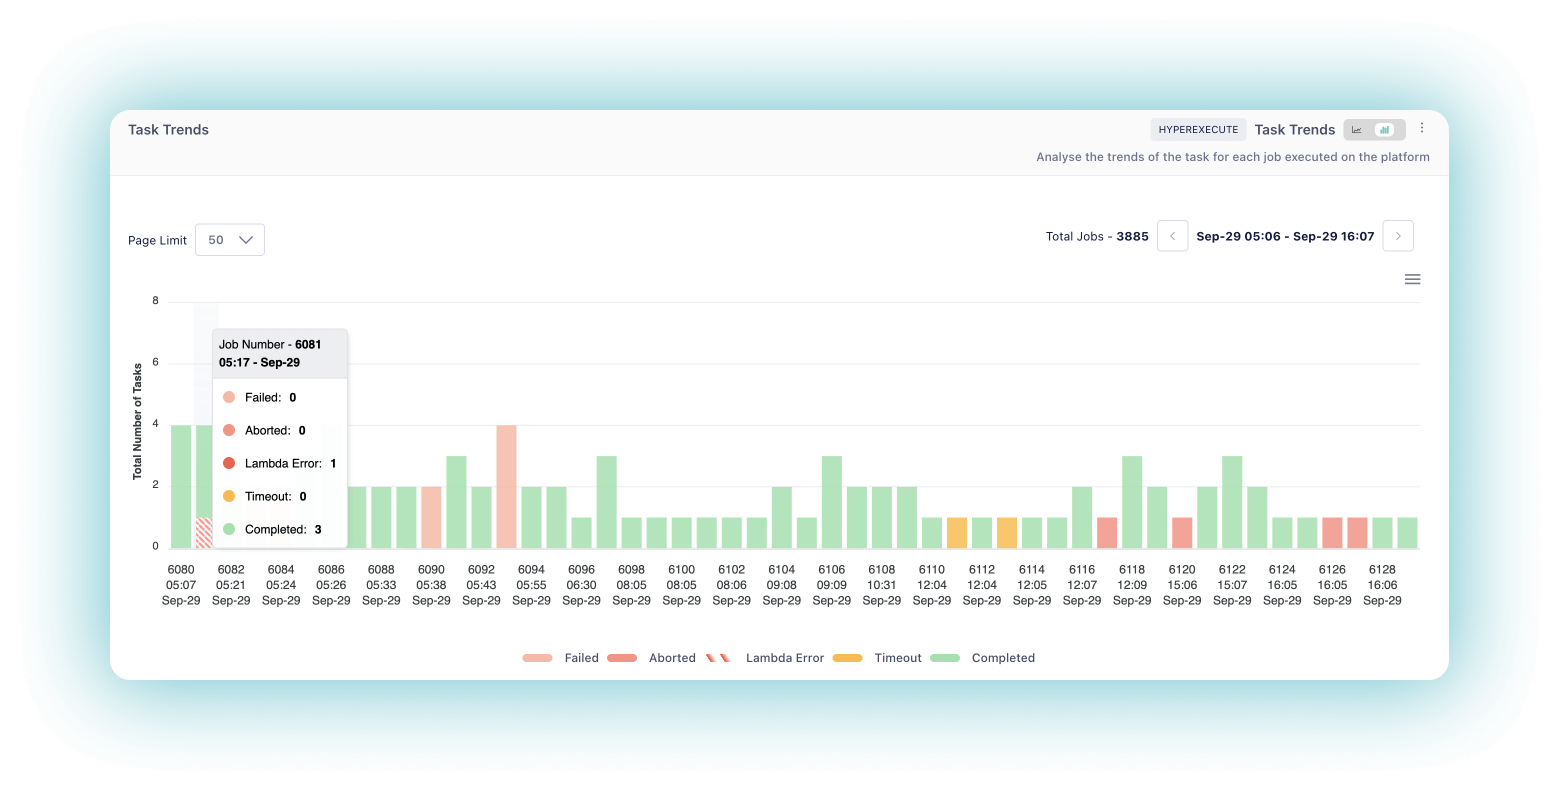
The Task Trends widget enables you to analyze the trends of tasks for each job executed on the platform, categorized into Completed, Failed, Aborted, Lambda Error, and Cancelled. You can filter the data by a specific date and time.
- X-Axis: Represents the time intervals at which the task trends are measured.
- Y-Axis: Represents the number of tasks categorized by their status.
How It Works
- The widget tracks the number of tasks and their respective statuses over a specified time period.
- It presents the task trends in a graph format, displaying the number of tasks for each status at each time interval.
- You can hover over specific data points to view the exact number of tasks for each status at that particular time.
Value Proposition
By examining the Task Trends widget, you can identify patterns, fluctuations, or anomalies in your task execution over time. This information helps you assess the stability and reliability of specific tasks within your HyperExecute testing pipeline, allowing you to proactively address any emerging issues and ensure the consistent quality of your tasks.
Use Case
John can use the Task Trends widget to:
- Understand the status distribution of tasks in the jobs executed by his team.
- Identify any failing tasks and gather information for troubleshooting.
The HyperExecute Analytics module provides a powerful set of tools to gain deep insights into your HyperExecute testing pipeline. By leveraging these widgets, you can optimize your testing process, identify bottlenecks, and ensure the smooth execution of your jobs, stages, and tasks.
Unlock the full potential of HyperExecute Analytics today and take your testing game to the next level!

 Chat with Us