SmartUI in the Automation Dashboard
What this feature is
Users can now view, group, and review their SmartUI visual regression results directly inside the Automation Dashboard, without switching products.
Every automation test run that captures SmartUI screenshots now has a dedicated SmartUI tab alongside the existing All Commands, Logs, Networks, and Meta Data tabs. From that tab users can see the build's screenshots, their comparison status, group them by test, and jump straight into SmartUI for a full review when they need to.
This works across Web Automation and App Automation.
The problem it solves
Until now, understanding why a visual test failed meant working across two separate places:
- Users would see a test fail in the Automation Dashboard, then
- Open SmartUI separately, find the matching build, and triage the screenshots there.
For teams running large suites, that context-switching added up to significant manual triage overhead: repetitive, slow, and disconnected from the automation run that produced the results.
This feature closes that gap. The visual results live next to the test that generated them, so triage happens in one flow.
What users gain
| Before | Now |
|---|---|
| Switch between Automation and SmartUI to investigate a failure | Review screenshots in the SmartUI tab on the test page |
| Screenshots listed flat, hard to scan in big runs | Group screenshots by test name / suite |
| Approve or reject one screenshot at a time | Review and approve at the test-case level |
| No direct path between the two products | One-click deep link from a build into full SmartUI |
Key capabilities
1. SmartUI tab in the test view
Open any test in the Automation Dashboard and select the SmartUI tab. Users will see the associated Project and Build, a total screenshot count, and a status roll-up showing how many screenshots are new, changed, approved, or rejected.
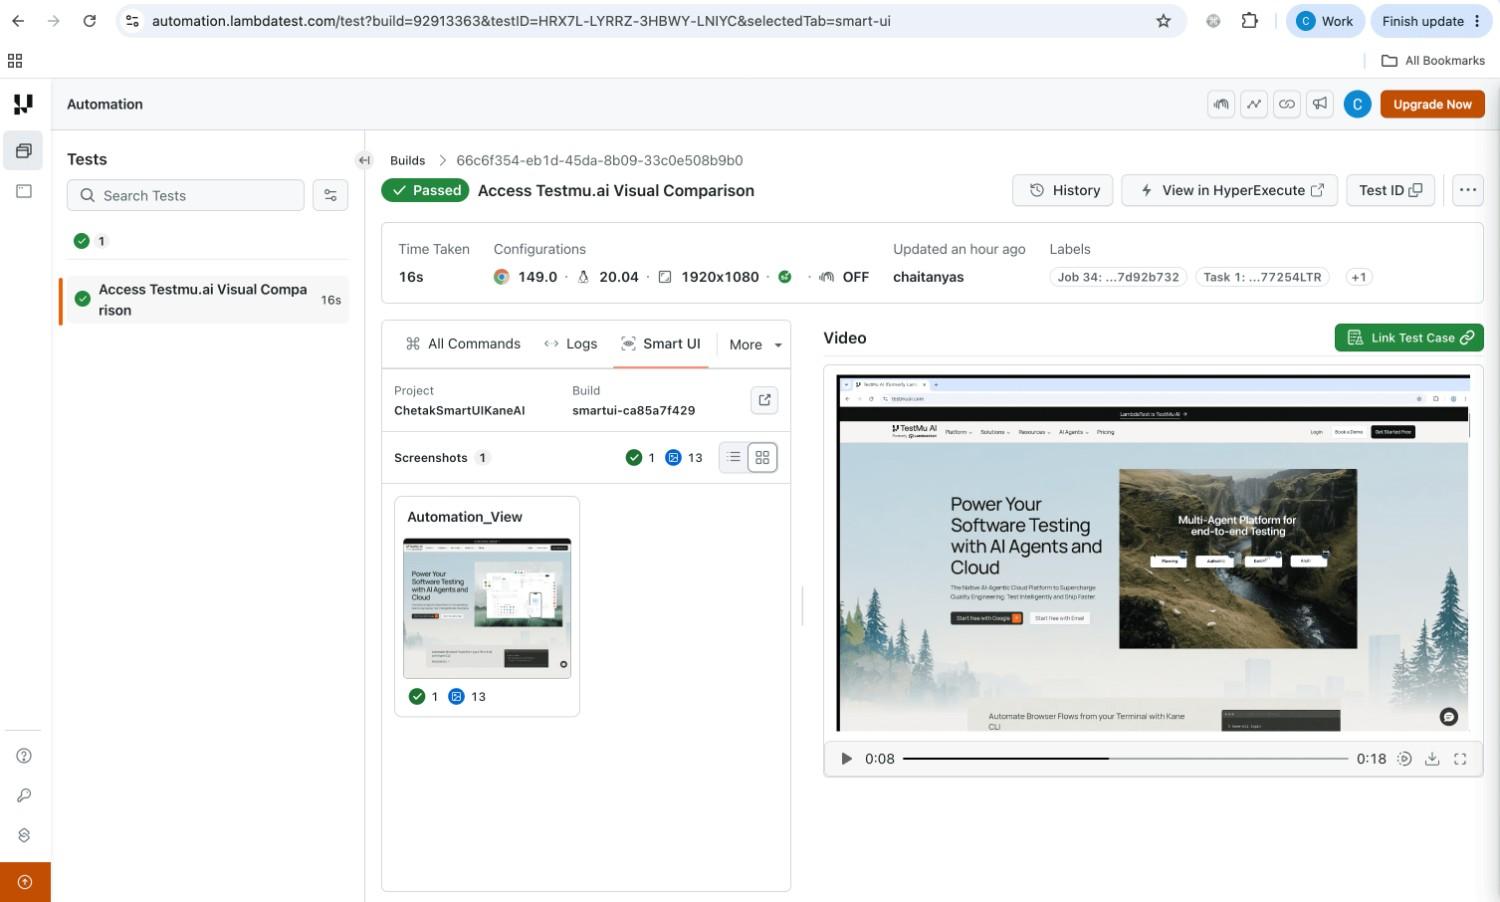
2. Grid and List views
Toggle between a Grid view (screenshot thumbnails, ideal for a quick visual scan) and a List view (compact rows with per-screenshot status counts, ideal for dense builds). Use whichever suits the run.
3. Group by test
Organize screenshots by automation suite or test name so related screenshots stay together — far easier to navigate than a flat list when a run produces dozens of screenshots.
4. Deep link into SmartUI
The View in SmartUI link on a build takes users straight to the full SmartUI experience for that build.
How to use it
- Open the Automation Dashboard and select the test the user wants to inspect.
- In the test detail view, click the SmartUI tab (next to Meta Data).
- Review the build summary at the top: Project, Build, screenshot count, and status counts.
- Choose Grid or List view using the toggle on the screenshots panel.
- Optionally, use Group by to cluster screenshots by test, and Status to filter to a specific state.
Availability and access
- The feature appears as a tab in the test view for any test that has associated SmartUI screenshots; tests without SmartUI data won't show SmartUI content.
- It is rolled out progressively. If the user does not see the SmartUI tab and expects to, their account may not yet be enabled — contact the account team or support.
- Requires an active SmartUI project linked to the automation run.
Tips and known behavior
- Real Device sessions: Screenshots are matched to the user's test even when a session identifier isn't present, so results display reliably for Real Device runs.
- Mixed runs: App Automation and Web-Automation-with-Real-Device tests each route to their correct dashboard when the user follows a deep link.
- For the cleanest grouping, use consistent, descriptive test names in the automation suite — these are what the Group by test view uses to cluster screenshots.
FAQ
Do I need to change my test scripts to use this? No. If the user's automation run already captures SmartUI screenshots, they'll appear in the SmartUI tab automatically.
Is this a replacement for the SmartUI product? No, it's an embedded view for fast, in-context triage. For the full diff viewer, baseline management, and ignore-region tools, use View in SmartUI to open the complete experience.
Will it work for my mobile / app tests? Yes. The integration supports Web Automation, App Automation, and Real Device sessions.
Why don't I see the SmartUI tab on a particular test? That test likely has no associated SmartUI screenshots, or the feature isn't yet enabled for the user's account. Check that a SmartUI project is linked to the run, and reach out to support if needed.
Need help getting this enabled for an account? Contact the TestMu AI account team or support.
