Bar and Line Chart Widgets
Bar and Line chart widgets in LambdaTest Insights enable you to visualize test data trends, comparisons, and patterns. Bar charts are ideal for comparing values across categories, while line charts excel at showing trends and changes over time.
What are Bar and Line Chart Widgets?
Bar Chart Widgets
Bar chart widgets display data using rectangular bars where the length of each bar represents the value. They are particularly effective for:
- Comparing values across different categories (e.g., test counts by browser, pass rates by OS)
- Showing distributions of data across groups
- Highlighting differences between categories at a glance
- Grouped comparisons when using the Group By feature
Line Chart Widgets
Line chart widgets display data as a series of points connected by lines. They are particularly effective for:
- Tracking trends over time (e.g., test execution trends, pass rate changes)
- Identifying patterns and anomalies in time series data
- Comparing multiple series on the same chart
- Forecasting based on historical patterns
Prerequisites
Before creating a bar or line chart widget, ensure you have completed the common prerequisites and setup steps for custom widgets.
Step-by-Step Guide to Creating Bar and Line Chart Widgets
For prerequisites and common setup steps (Navigate to Insights, Create Dashboard, Choose Product, Select Data Source, Configure Filters), see the Common Steps for Creating Custom Widgets section in the main Custom Widgets documentation.
Step 6: Choose Visualization Type
- In the Choose Visualisation section, select either:
- Bar for bar chart visualization
- Line for line chart visualization
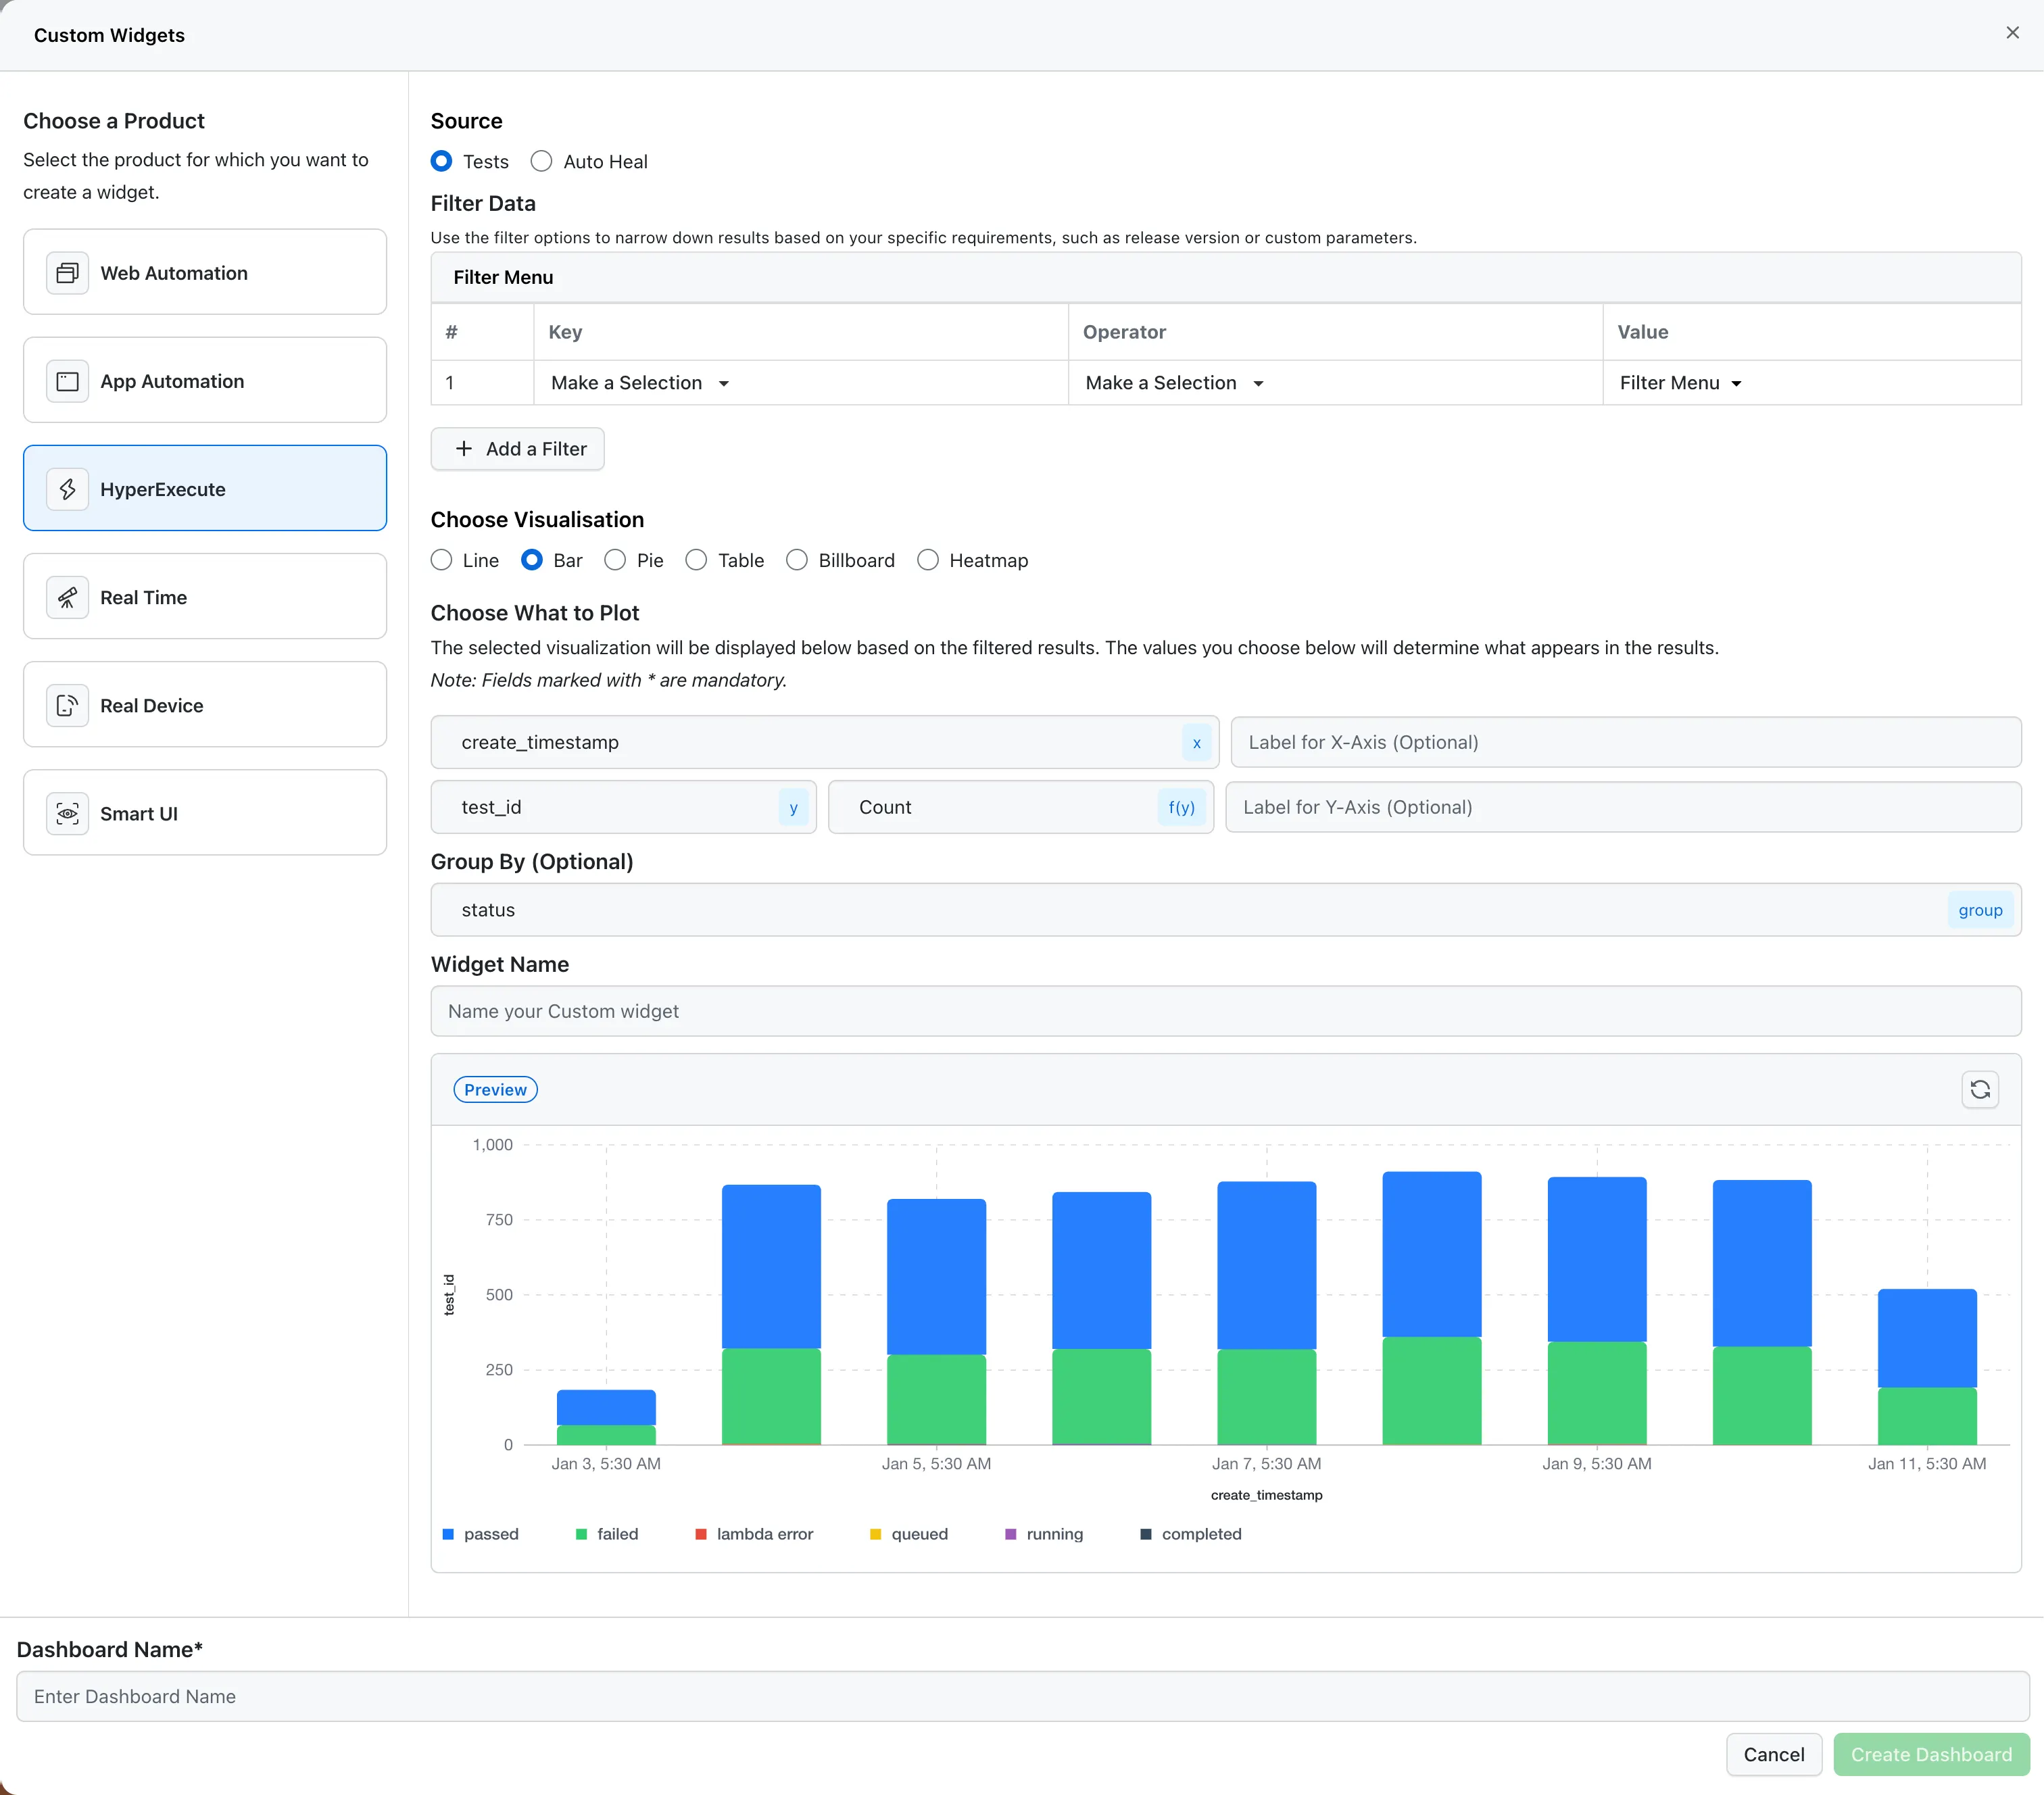
Step 7: Configure What to Plot
This is the most critical step for creating meaningful charts:
X-Axis Configuration
- X-Axis Field* (Mandatory): Select the field to display on the horizontal axis. This determines what categories or time points will be shown.
- For time-based trends: Use fields like
create_timestamp,start_time, orend_time - For categorical comparisons: Use fields like
browser,os,status,project_name
- For time-based trends: Use fields like
- Label for X-Axis (Optional): Provide a custom label for the X-axis to make your chart more readable (e.g., "Test Execution Date", "Browser Type").
Y-Axis Configuration
-
Y-Axis Field* (Mandatory): Select the field to aggregate and display on the vertical axis.
- Common fields:
test_id,duration, or any numeric field
- Common fields:
-
Aggregation Function* (Mandatory): Choose how to aggregate the Y-axis field:
- Count: Number of records (most common for test counts)
- Sum: Sum of values
- Average: Average value
- Minimum: Minimum value
- Maximum: Maximum value
- Unique Count: Count of unique values
- Percentiles (50th, 75th, 90th, 95th, 99th): For duration and other numeric fields
-
Label for Y-Axis (Optional): Provide a custom label for the Y-axis (e.g., "Number of Tests", "Average Duration (seconds)").
For a complete list of available keys for each product, see the Available Keys for Custom Widgets section in the main Custom Widgets documentation.
Step 8: Configure Group By (Optional)
The Group By field allows you to create multiple series on the same chart:
- Select a field to group by (e.g.,
status,browser,os). - This will create separate bars or lines for each unique value in the selected field.
- Each group will be displayed with a different color and appear in the legend.
Example: Grouping by status will show separate bars/lines for "passed", "failed", "queued", etc., allowing you to compare test statuses over time or across categories.
Step 9: Name Your Widget
- Enter a descriptive name in the Widget Name field (e.g., "Test Execution Trends by Status", "Browser Comparison - Test Counts").
- Use clear, descriptive names that indicate what the chart shows.
Step 10: Preview Your Chart
- Click the Preview button to see how your chart will look with the current configuration.
- Review the visualization to ensure it displays the data as expected.
- Use the refresh icon to update the preview if you make changes.
Step 11: Create the Dashboard
- Enter a Dashboard Name in the bottom section.
- Click Create Dashboard to save your chart widget.
- Your chart will be added to the dashboard and ready for analysis.
How Bar and Line Charts Work
Understanding how charts encode information is crucial for effective analysis:
X-Axis: Categories or Time
The X-axis represents the categories or time points you want to analyze:
- Time-based X-axis: Use timestamp fields to show trends over time. The chart will display data points chronologically.
- Category-based X-axis: Use categorical fields (browser, OS, status) to compare values across different groups.
Y-Axis: Aggregated Values
The Y-axis represents the aggregated metric you want to visualize:
- The value is calculated using the selected aggregation function (Count, Sum, Average, etc.)
- For each X-axis value, the Y-axis shows the aggregated result
- Multiple Y-axis values can be shown when using Group By
Group By: Multiple Series
When you use Group By, the chart displays multiple series:
- Each unique value in the Group By field becomes a separate series
- Each series is displayed with a different color
- A legend shows what each color represents
- This allows you to compare multiple dimensions simultaneously
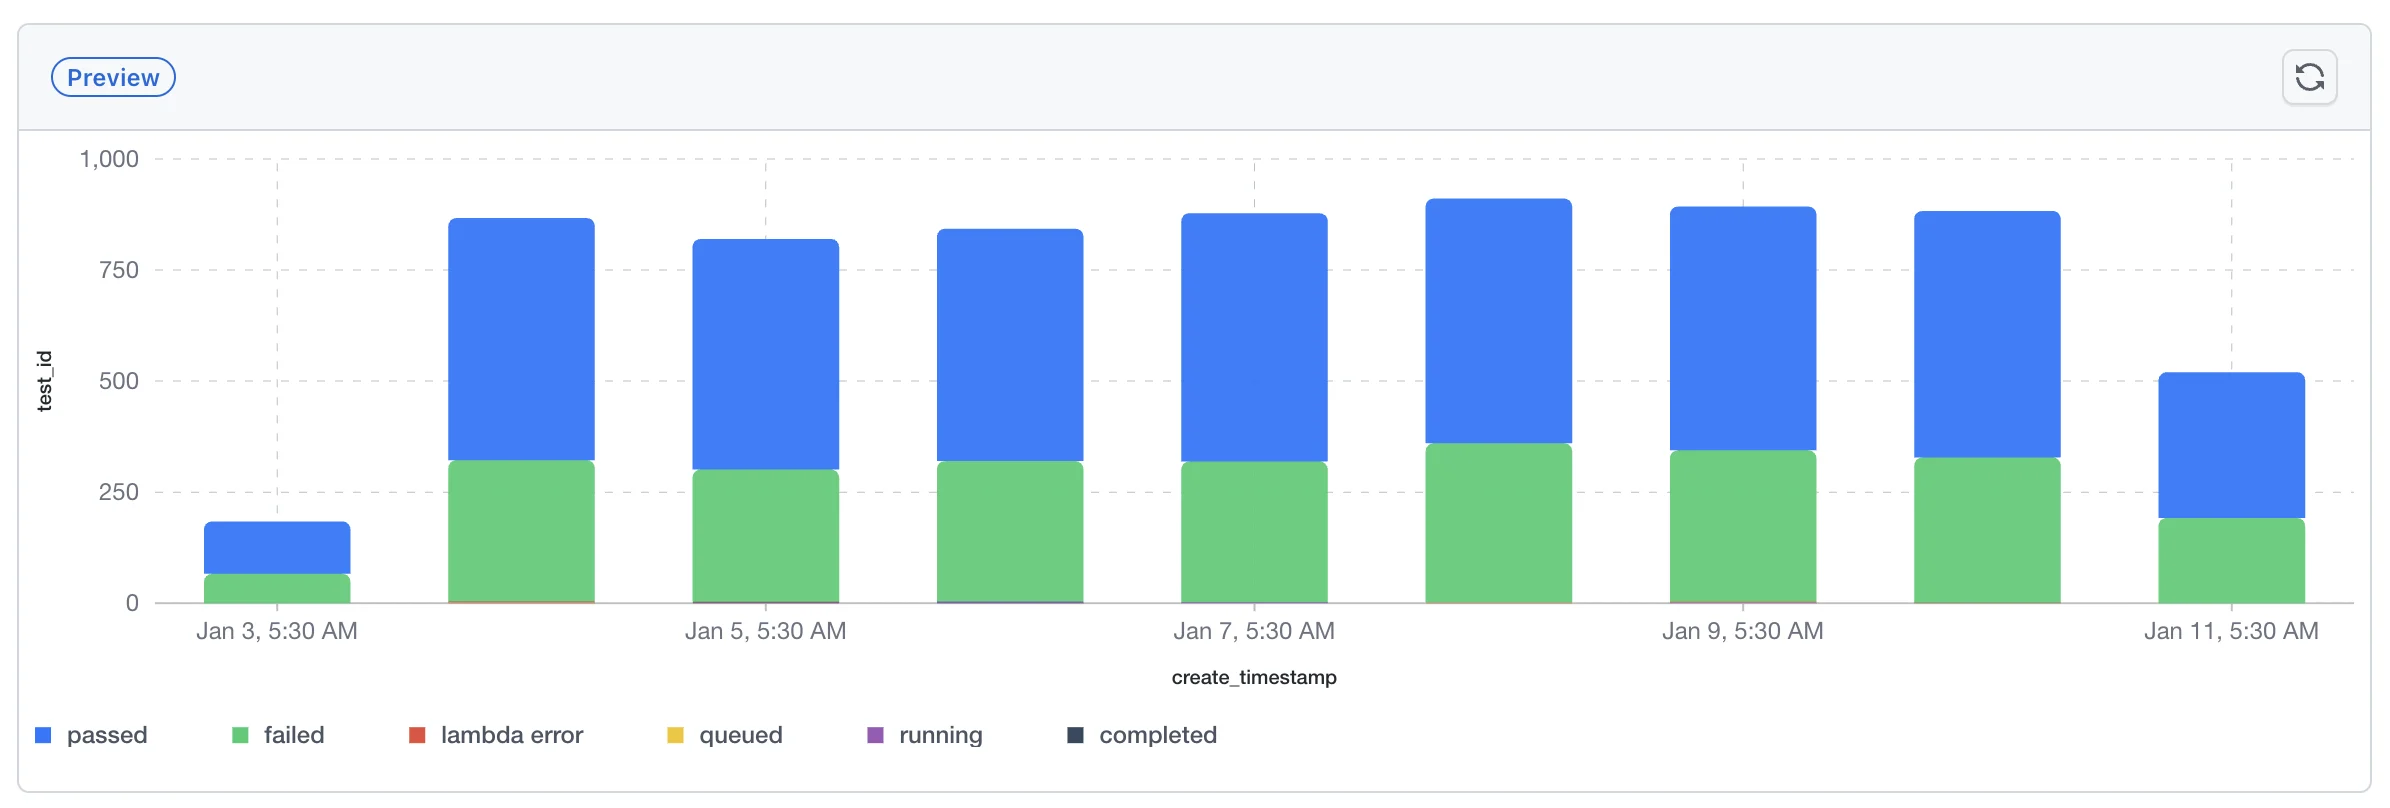
Example:
- X-axis:
create_timestamp(time) - Y-axis:
test_idwith Count aggregation - Group By:
status
This creates a chart showing test counts over time, with separate lines/bars for each status (passed, failed, queued, etc.).
Generating Meaningful Insights from Charts
Understanding Bar Charts
- Bar Height: Indicates the magnitude of the value
- Bar Comparison: Compare heights across categories to identify patterns
- Stacked Bars: When using Group By, bars are displayed as stacked segments, with each segment representing a different group value (e.g., different statuses). Each segment is color-coded according to the legend, allowing you to see both the total value and the breakdown within each bar
- Segment Analysis: Each colored segment in a stacked bar represents the contribution of that group to the total value
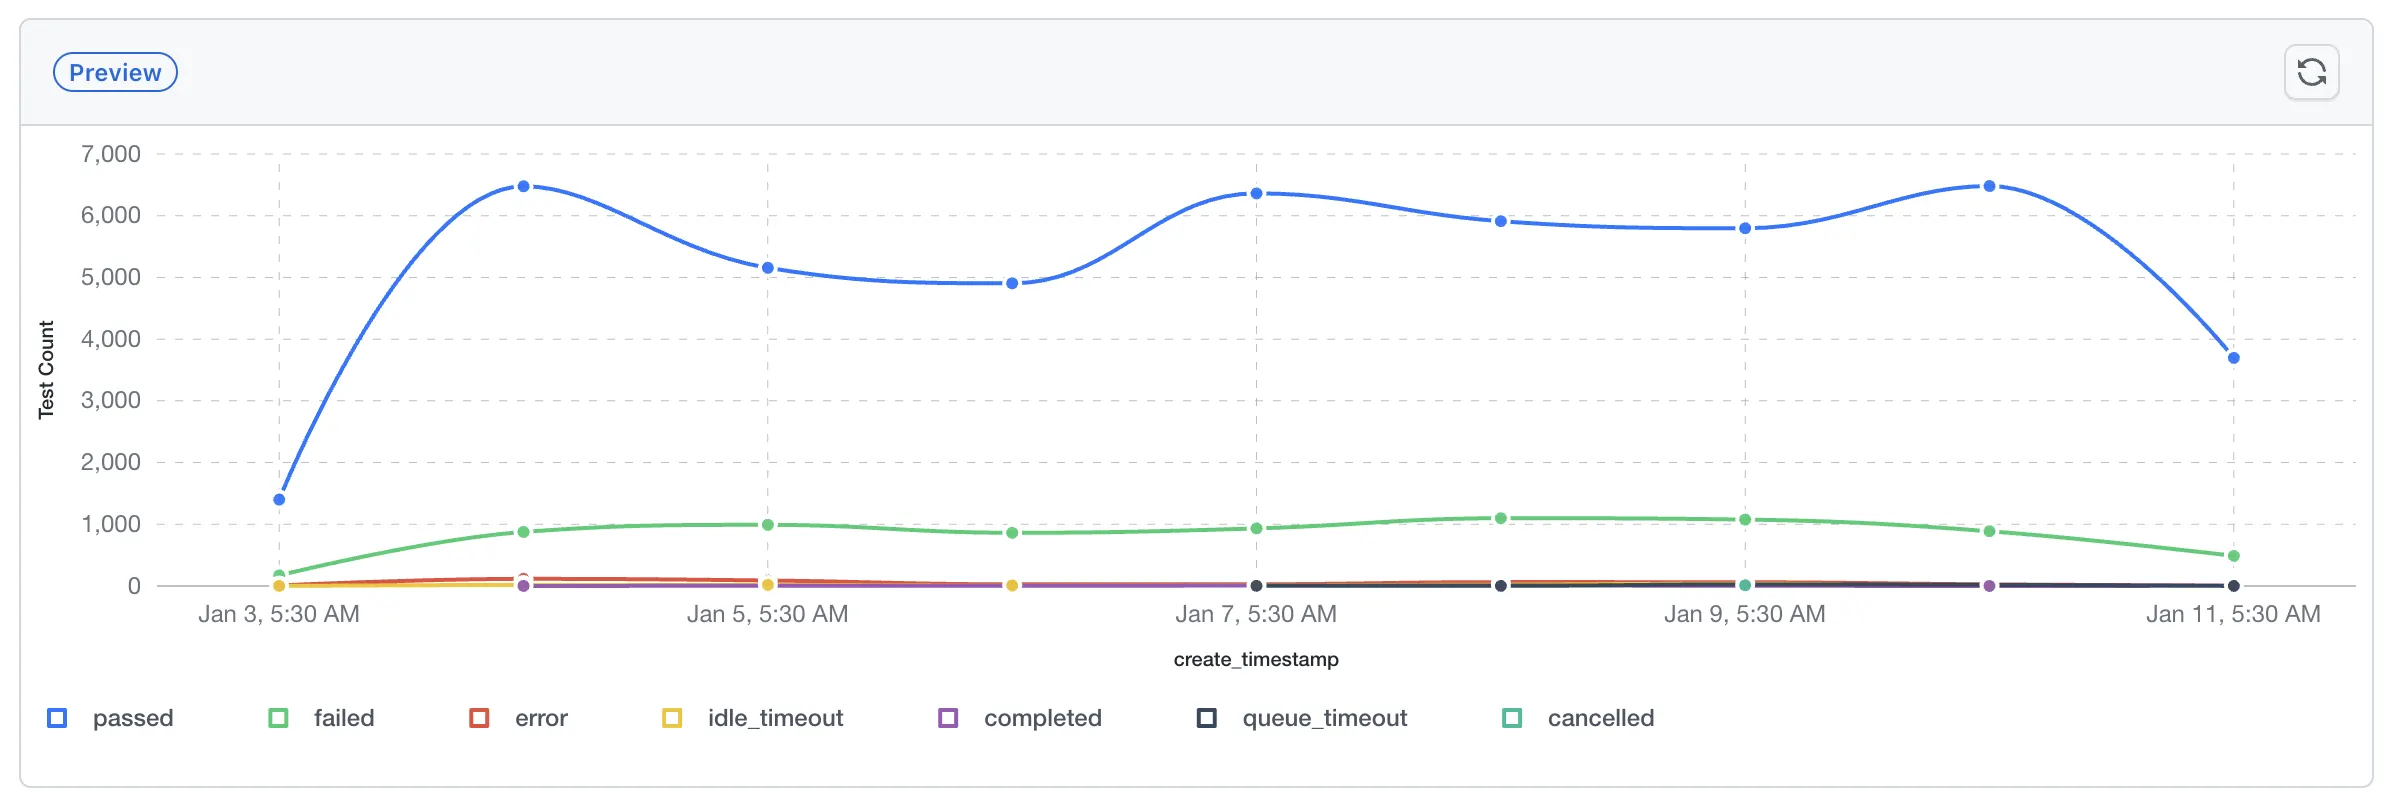
Understanding Line Charts
Line charts display multiple data series as colored lines, each representing a different group when using Group By. Key elements to understand:
- Trend Direction: Upward trends indicate growth, downward trends indicate decline
- Steepness: Steep lines indicate rapid changes
- Plateaus: Flat sections indicate stable periods
- Intersections: Where lines cross indicates when values become equal
- Gaps: Missing data points may indicate issues or gaps in testing
- Multiple Series: When using Group By, each unique value becomes a separate line with its own color, allowing you to compare trends across different groups simultaneously
- Data Points: Each point on a line represents the aggregated value at that X-axis position
- Legend: The legend shows which color corresponds to which group, helping you identify each series
Key Insights to Look For
- Trends Over Time: Identify increasing, decreasing, or stable patterns in your test execution
- Peaks and Valleys: Spot unusual spikes or drops that may indicate issues or changes
- Comparisons: Compare values across categories to identify best/worst performers
- Correlations: When using Group By, observe relationships between different series
- Anomalies: Unexpected patterns that deviate from normal behavior
- Seasonality: Recurring patterns that repeat at regular intervals
Interacting with Charts
Bar and line charts provide interactive features to explore your data in detail:
-
Hover: Hover over bars (in bar charts) or data points (in line charts) to see detailed tooltips showing:
- The exact X-axis value (timestamp or category)
- Breakdown of values for each group (when using Group By)
- Specific counts or aggregated values for each series
- Color-coded indicators matching the legend
Example for Bar Charts: When hovering over a bar in a chart grouped by
status, the tooltip will show the timestamp or category, along with separate counts for "passed", "failed", "queued", "completed", etc., each with its corresponding color indicator.Example for Line Charts: When hovering over a data point on a line chart grouped by
status, the tooltip displays the exact timestamp and shows the breakdown of values for all statuses at that point in time (e.g., passed: 4,721, failed: 1,015, error: 24, etc.), allowing you to see the complete picture for that specific moment. -
Legend Interaction: Click on legend items to show/hide specific series, allowing you to focus on particular groups
-
Zoom and Pan: Some chart configurations may support zooming and panning for detailed exploration
-
Export: Charts can be exported or shared as part of your dashboard
Use Cases for Bar and Line Chart Widgets
1. Test Execution Trends Over Time
Use Case: Track the number of tests executed over time to monitor testing activity.
Configuration:
- X-Axis:
create_timestamporstart_time - Y-Axis:
test_idwith Count aggregation - Group By:
status(optional, to see breakdown by status) - Visualization: Line Chart
Insight: Identify testing activity patterns, peak testing periods, and trends in test execution volume. When grouped by status, you can see separate trend lines for passed, failed, and other test statuses, making it easy to compare how different statuses change over time.
2. Test Status Distribution by Browser
Use Case: Compare test results across different browsers to identify browser-specific issues.
Configuration:
- X-Axis:
browser - Y-Axis:
test_idwith Count aggregation - Group By:
status - Visualization: Bar Chart
Insight: Quickly identify which browsers have the most failures and which perform best.
3. Average Test Duration by OS
Use Case: Analyze test execution times across different operating systems.
Configuration:
- X-Axis:
os - Y-Axis:
durationwith Average aggregation - Visualization: Bar Chart
Insight: Identify OS-specific performance differences and optimize testing strategy.
4. Test Count Trends by Project
Use Case: Monitor testing activity across different projects over time.
Configuration:
- X-Axis:
create_timestamp - Y-Axis:
test_idwith Count aggregation - Group By:
project_name - Visualization: Line Chart
Insight: Track project-specific testing trends and ensure balanced testing across projects.
5. Pass Rate Trends Over Time
Use Case: Monitor test pass rates to track quality improvements or regressions.
Configuration:
- X-Axis:
create_timestamp - Y-Axis: Calculate pass rate (may require custom aggregation or filtering)
- Visualization: Line Chart
Insight: Identify quality trends and correlate with releases or changes.
6. Browser Version Comparison
Use Case: Compare test execution across different browser versions.
Configuration:
- X-Axis:
browser_version - Y-Axis:
test_idwith Count aggregation - Group By:
status - Visualization: Bar Chart
Insight: Identify problematic browser versions and ensure comprehensive version coverage.
7. Daily Test Execution Summary
Use Case: Get a daily overview of test execution activity.
Configuration:
- X-Axis:
create_timestamp(grouped by day) - Y-Axis:
test_idwith Count aggregation - Group By:
status - Visualization: Bar Chart or Line Chart
Insight: Understand daily testing patterns and identify days with unusual activity.
Available Keys for Bar and Line Chart Widgets
For a complete list of available keys that can be used for X-axis, Y-axis, and Group By fields in bar and line chart widgets, see the Available Keys for Custom Widgets section in the main Custom Widgets documentation.
Choose keys that represent categorical dimensions (like browser, OS, project name) for X-axis, and numeric or countable fields for Y-axis aggregation. For time-based trends, use timestamp fields for the X-axis.
Best Practices for Bar and Line Chart Widgets
1. Choose Appropriate Chart Type
- Use Bar Charts for:
- Comparing values across categories
- Showing distributions
- When categories are discrete and not time-based
- Use Line Charts for:
- Showing trends over time
- Comparing multiple time series
- Identifying patterns in sequential data
2. Select Meaningful Axes
- X-Axis: Choose fields that create logical groupings or time sequences
- Y-Axis: Select fields that provide meaningful metrics when aggregated
- Aggregation: Choose the right aggregation function (Count for test counts, Average for durations, etc.)
3. Use Group By Strategically
- Use Group By to compare multiple dimensions simultaneously
- Avoid too many groups (more than 5-7) as it can make charts cluttered
- Choose grouping fields that create meaningful comparisons
4. Apply Filters Effectively
- Use filters to focus on relevant subsets of data
- Combine multiple filters to create highly targeted charts
- Filter by time ranges, projects, or other relevant dimensions
5. Name Widgets Clearly
Use descriptive names that indicate what the chart shows, including:
- The metric being visualized
- The time period or categories
- Any grouping applied
6. Regular Review and Updates
- Review charts regularly to identify new patterns or issues
- Update filters and dimensions as your testing strategy evolves
- Create multiple charts with different configurations to explore various aspects
Troubleshooting
Chart Shows No Data
- Check Filters: Ensure filters aren't too restrictive
- Verify Data Source: Confirm you have test data for the selected product
- Check Field Selection: Ensure the selected X-axis and Y-axis fields have data
- Verify Time Range: If using time-based X-axis, ensure data exists in the selected time period
Chart is Too Cluttered
- Reduce Group By Values: Use filters to limit the number of groups
- Simplify X-Axis: Choose X-axis fields with fewer unique values
- Use Filters: Narrow down the data using filters
Chart Doesn't Show Expected Trends
- Check Aggregation: Verify the aggregation function is appropriate for your Y-axis field
- Review Data Range: Ensure you have sufficient data points
- Adjust Time Granularity: For time-based charts, the granularity may affect trend visibility
Next Steps
After creating your bar or line chart widget:
- Add to Dashboard: Combine charts with other widgets for comprehensive analysis
- Share Dashboard: Share your dashboard with team members for collaborative insights
- Create Variations: Create multiple charts with different configurations to explore various aspects
- Review Regularly: Use insights from charts to identify areas needing attention and track improvements
Support
If you have any questions or need assistance with creating bar or line chart widgets, please reach out to our 24/7 customer support or visit our Support Center.
