View Lighthouse Performance Metrics Using Online Selenium Grid
TestMu AI integrates Lighthouse to view performance metrics (Lighthouse Audits) on its cloud-based Selenium Grid. You can view the scores of:
- Performance,
- Accessibility,
- Best Practices,
- SEO
- Progressive Web App
metrics with TestMu AI. TestMu AI also allows you to perform cross-browser testing on 3000+ combinations of real devices, browsers, and operating systems.
Note: TestMu AI currently supports Lighthouse on Chrome browsers for all Windows OS, macOS BigSur, macOS Mojave, and macOS Catalina.
Prerequisites
Complete these steps before generating Lighthouse reports.
- Create a TestMu AI account.
- Get your TestMu AI Username and Access Key from the Automation Dashboard or your TestMu AI Profile.
How to Include Lighthouse Performance Metrics in Selenium Automation
Add the performance capability to your desired capabilities to enable Lighthouse metrics.
You can add Lighthouse performance metrics for the website you want to test using the Desired Capabilities. Use the Performance feature of the Desired Capabilities Generator.
For example, if you are using TestNG for Selenium Automation on TestMu AI, include the Lighthouse performance feature with the below code snippet:
DesiredCapabilities caps = new DesiredCapabilities();
.
.

// To view performance metrics
caps.setCapability("performance", true);
Below is the code snippet to trigger Lighthouse performance metrics on TestMu AI in macOS Catalina with Google Chrome browser version 86.0.
DesiredCapabilities caps = new DesiredCapabilities();
                    caps.setCapability("browser", "Chrome");
                    caps.setCapability("version", "86");
                    caps.setCapability("platform", "macOS Catalina");
                    caps.setCapability("build", "Lighthouse Performance Demo");
                    caps.setCapability("name", "TestNG Test 3");
                    caps.setCapability("network", true);
                    caps.setCapability("visual", true);
                    caps.setCapability("video", true);
                    caps.setCapability("console", true);
                    caps.setCapability("selenium_version", "4");

                    // To view performance metrics
                    caps.setCapability("performance", true);
How to View Lighthouse Performance Metrics on TestMu AI
Access the Lighthouse performance report from the Automation Dashboard after running your tests.
Once you have run your Selenium automation tests on TestMu AI, you can view the Lighthouse performance metrics on the website under test.
Note: The test duration should be at least 30 seconds to generate the Lighthouse Performance Report.
Follow the below steps to view the Lighthouse performance metrics on TestMu AI:
1. Go to the Automation Dashboard. Here you can see your recently executed Selenium automation tests. For this demo, we used a sample TestNG script from this GitHub repository.
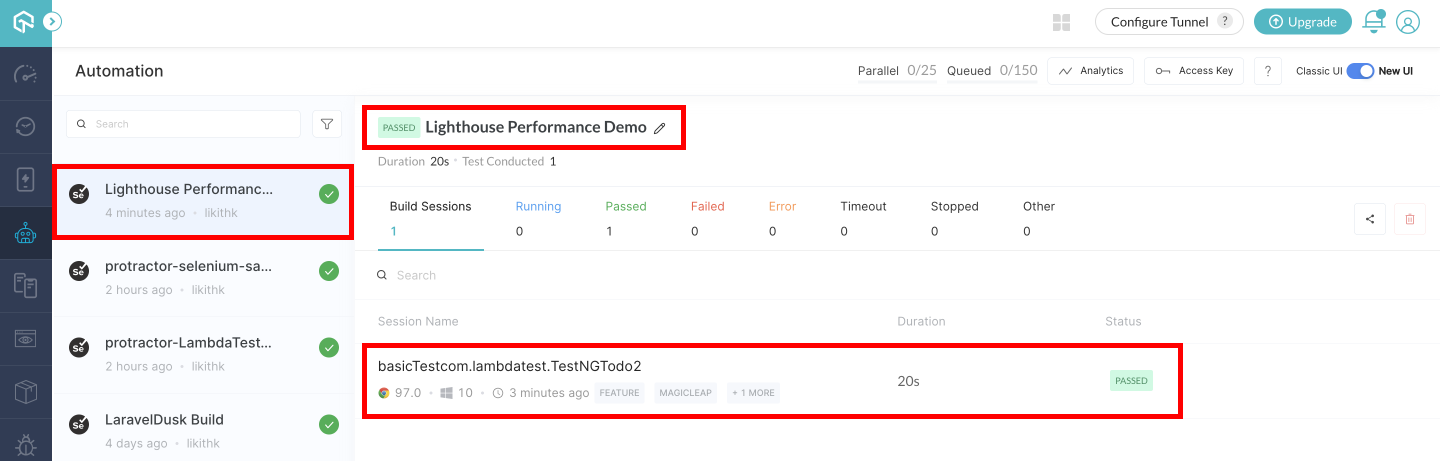
2. Click on the test in which you activated the Lighthouse performance feature, as shown above.
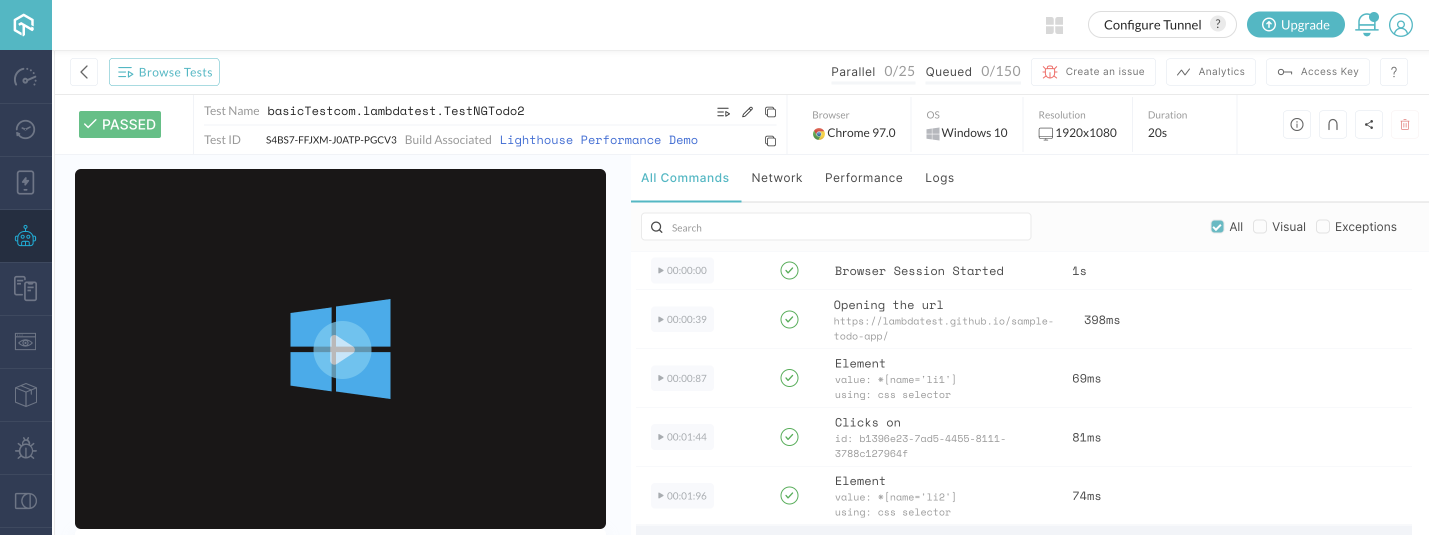
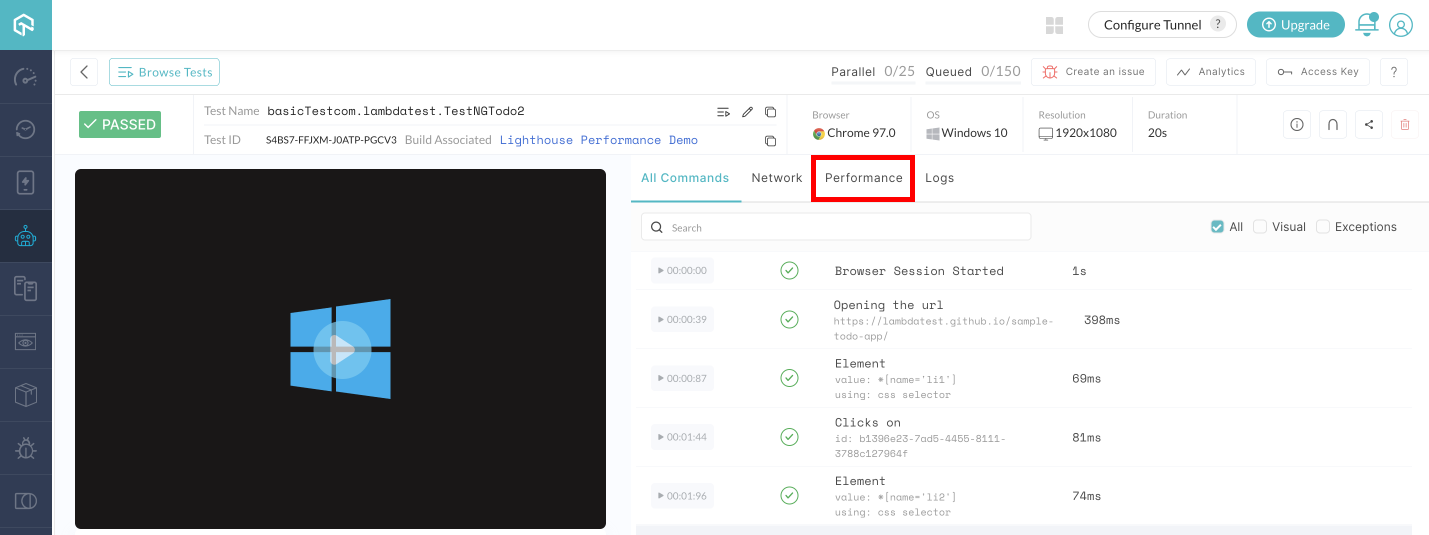
3. Click on the Performance tab.
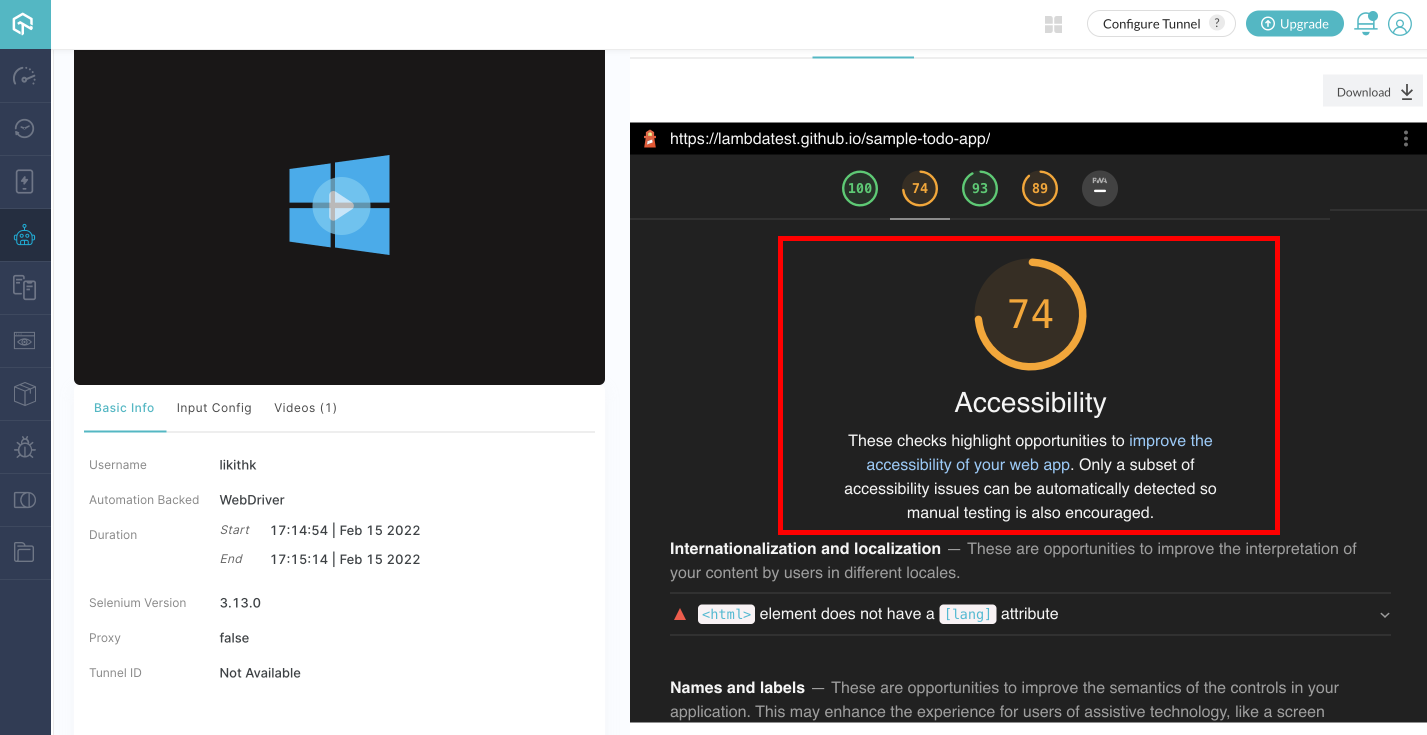
4. You can see the Lighthouse performance metrics on your screen for the website under test. For example, in the below image, the website under test is https://lambdatest.github.io/sample-todo-app/, which we used for our demo.
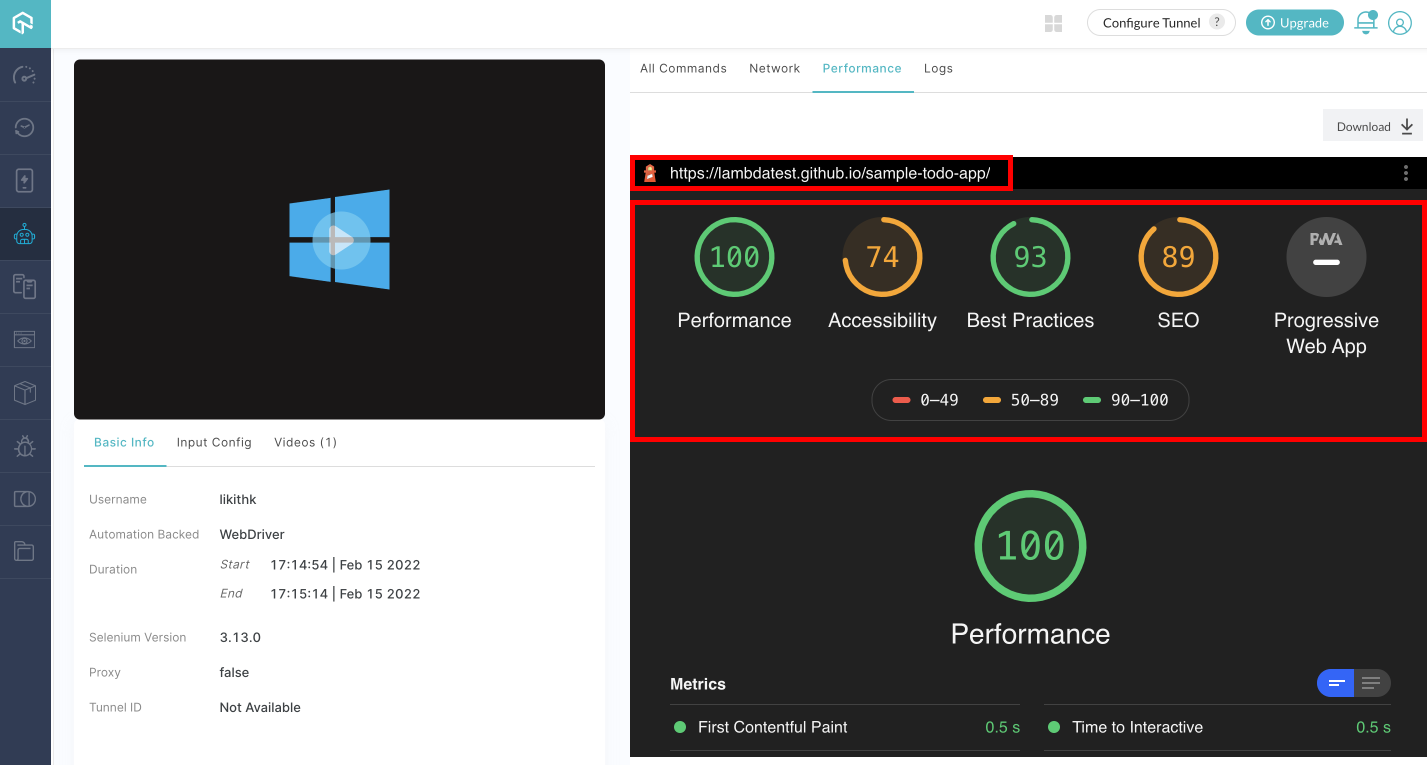
5. Click on any of the metrics to view it in detail, along with the individual factor scores. For example, clicking on Accessibility opens its details.
Similarly, you can click on any of the performance metrics to view it in detail. Performance reports can also be downloaded in various formats. TestMu AI also helps you view the Passed Audits, individual metrics, detailed diagnosis, and improvement opportunities for that particular Lighthouse Audit.
That's it folks! That's all about the Lighthouse Performance Metrics with TestMu AI. You can read more about the Lighthouse Audits and Performance Metrics from web.devpage. If you have any doubt or questions, feel free to contact our experts at 24/7 chat support or mail us at [email protected]. Happy testing! :)
