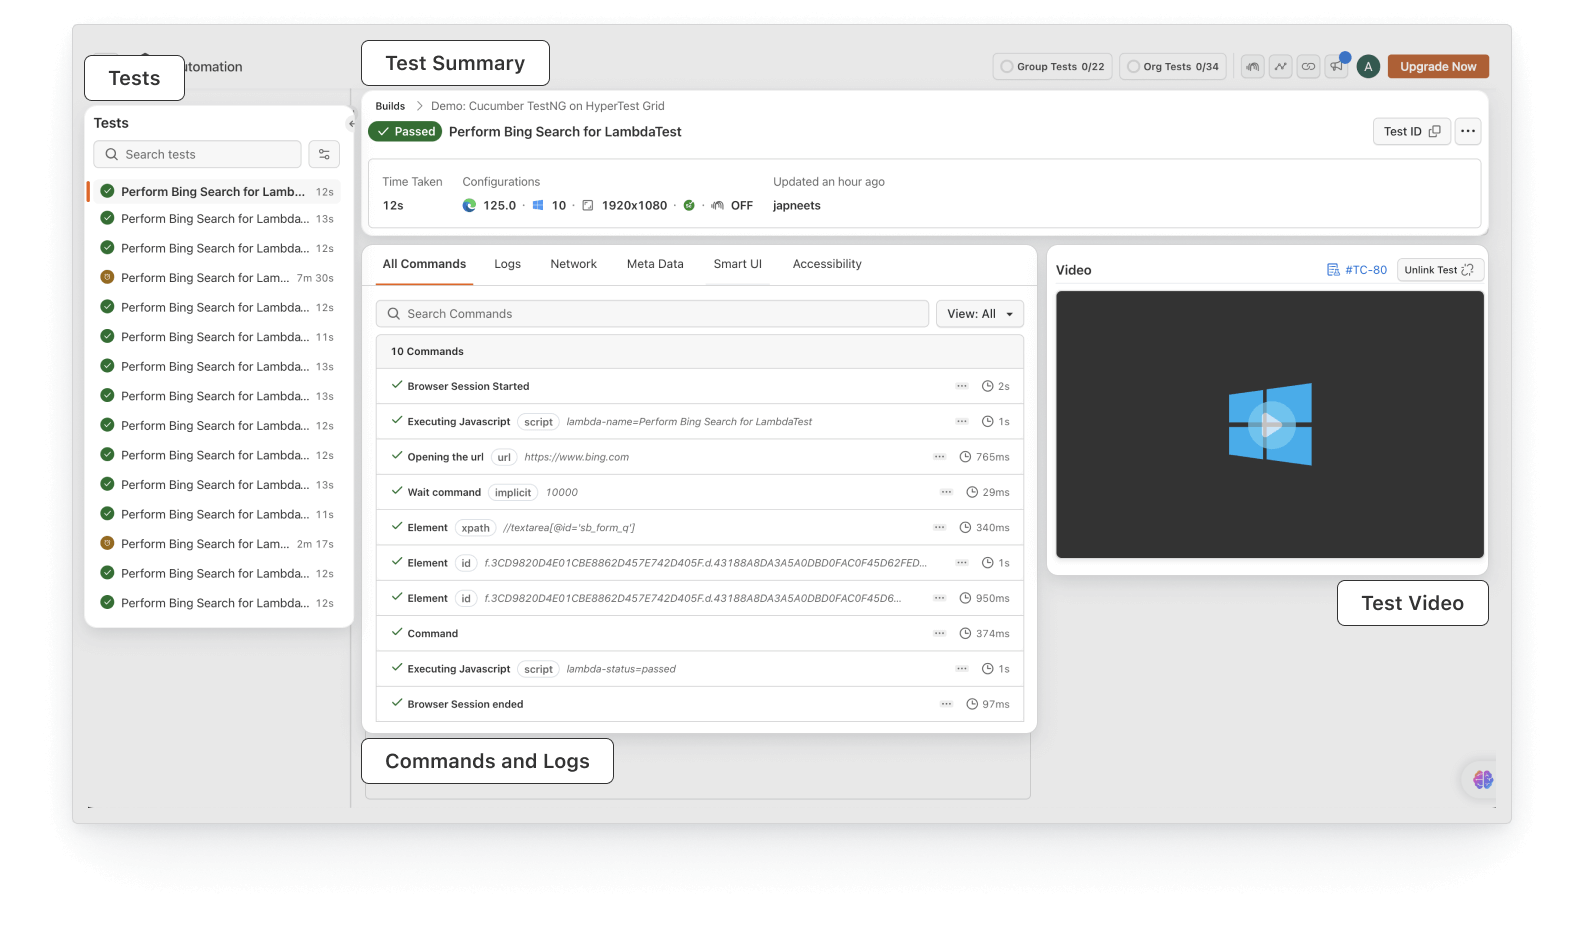
Explore the Automation Dashboard
The TestMu AI Automation Dashboard is where you view results, debug failures, and track every test you run on the grid. This page walks you through each section of the dashboard.
Build and Test Views
Filter and browse your tests using either the Build view or the Test view.
The dashboard groups your tests by build. Click any build to see its individual test cases. You can switch between Build and Test views depending on whether you want to see results grouped by build or listed individually.
Test Detail Page
Click any test to open its detail page with full execution data.
Each test detail page shows the build name, test status (pass/fail), execution time, browser and OS configuration, resolution, and framework used.
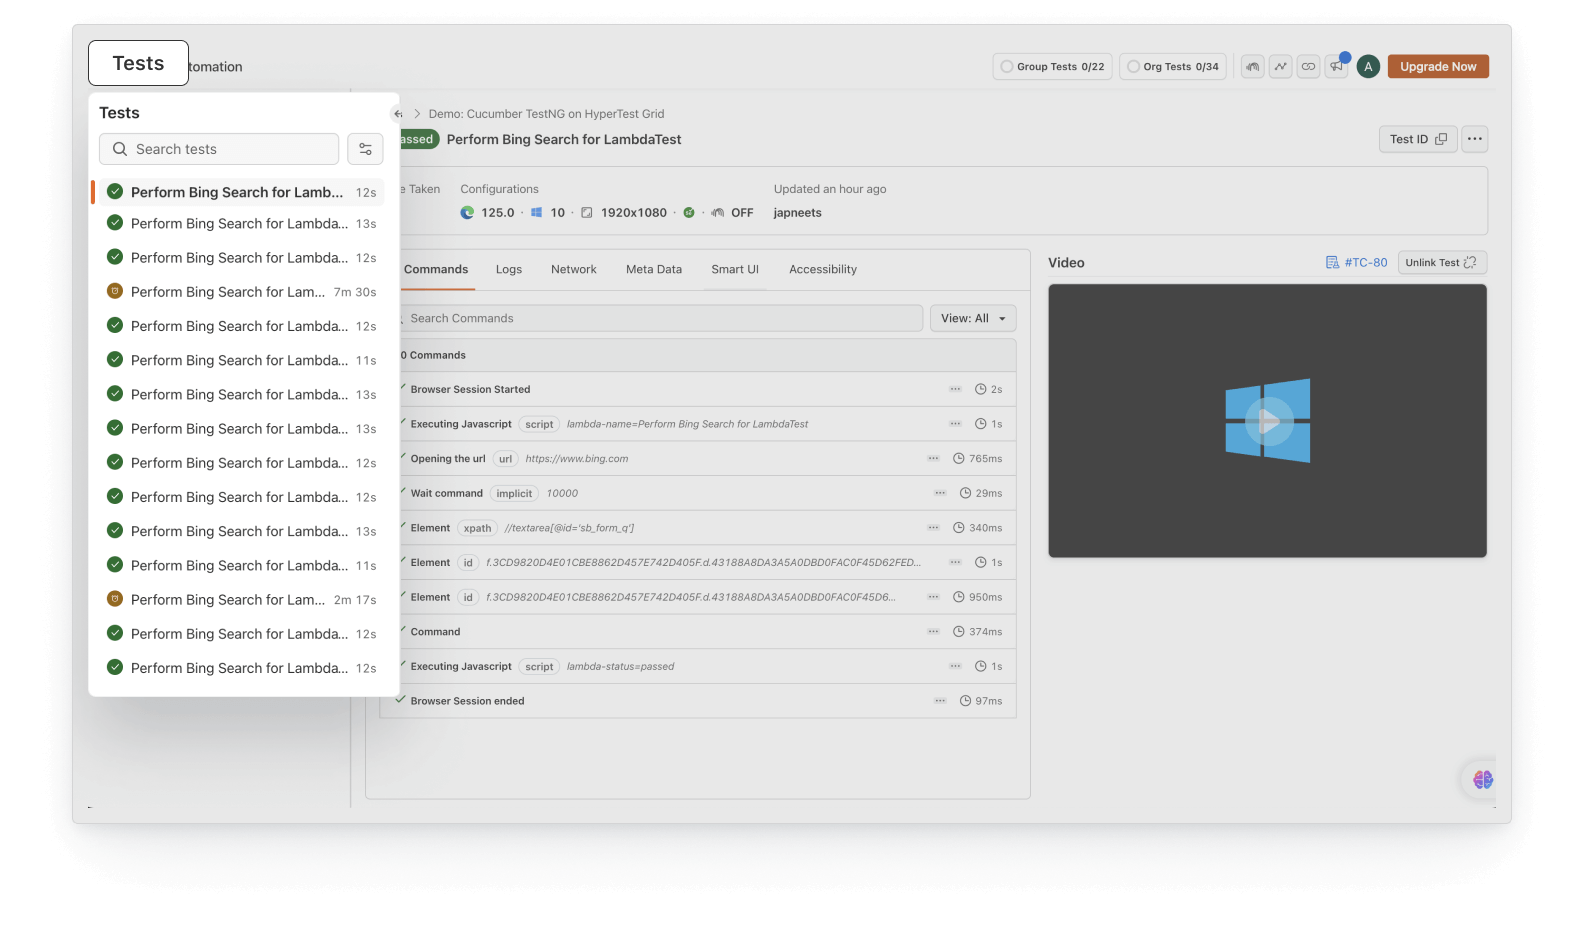
Test List Panel
The left panel lists all test cases within a build. Each entry shows the test status, execution time, and configuration.
You can sort by date, status, or duration. Use the search bar to find a specific test, or filter by browser, OS, status, or tags.
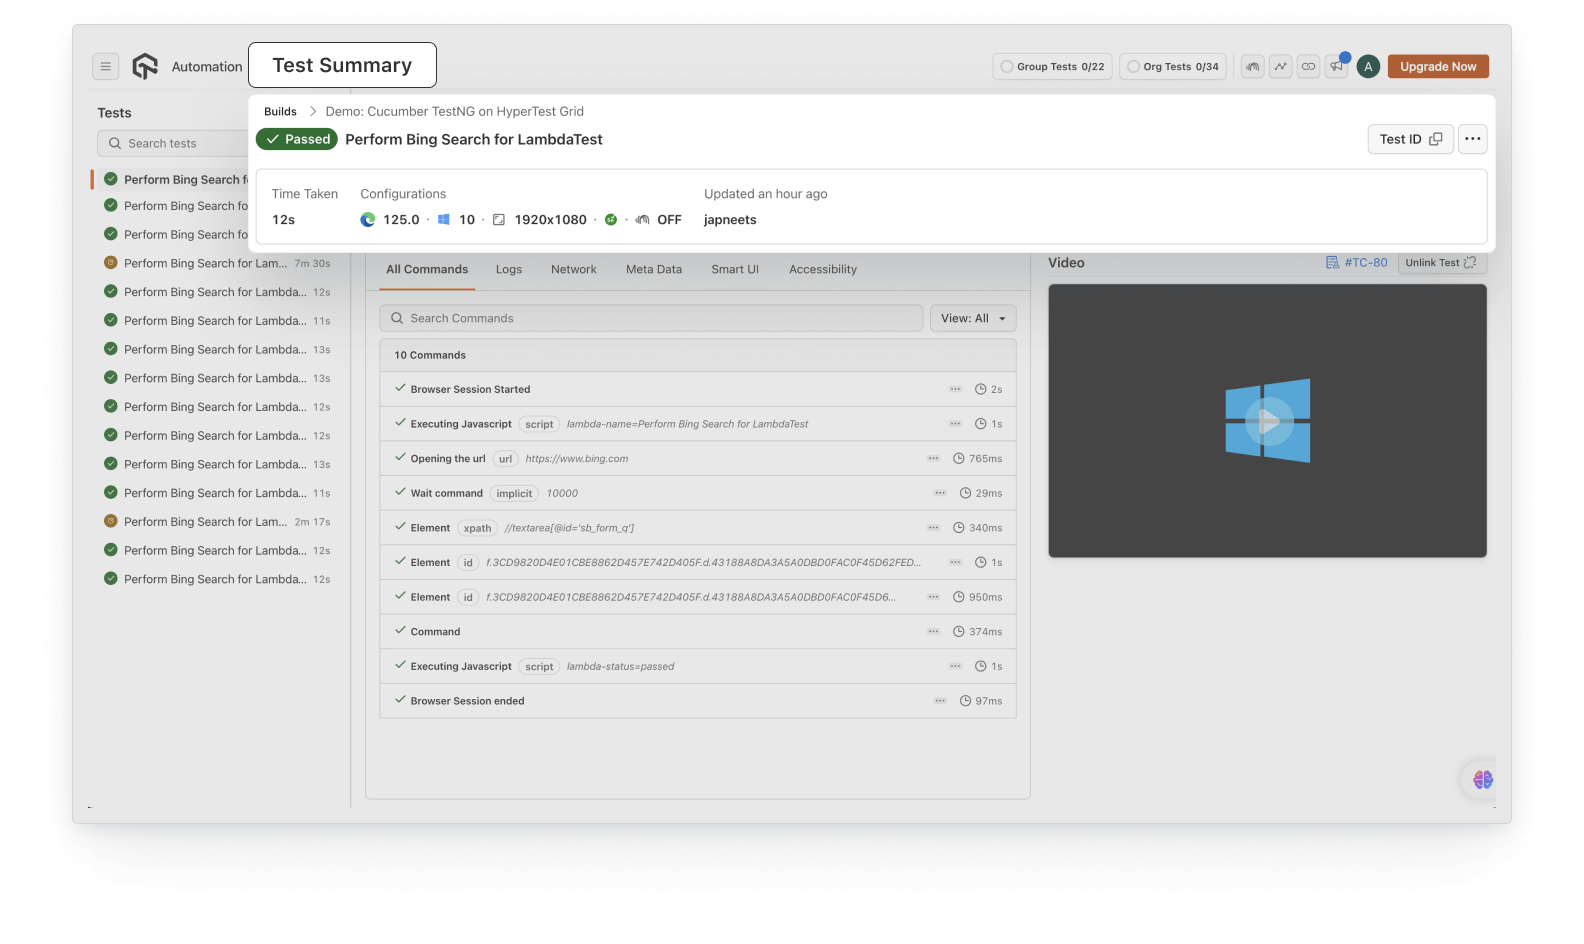
Test Summary
The summary section gives you a quick overview of the selected test.
It displays:
- Build name and test name
- Status - passed or failed
- Execution time
- Configuration - resolution, browser, OS, framework
- Last updated timestamp
Use the action buttons next to the test ID to copy the ID, create an issue, rename, share, or delete the test.
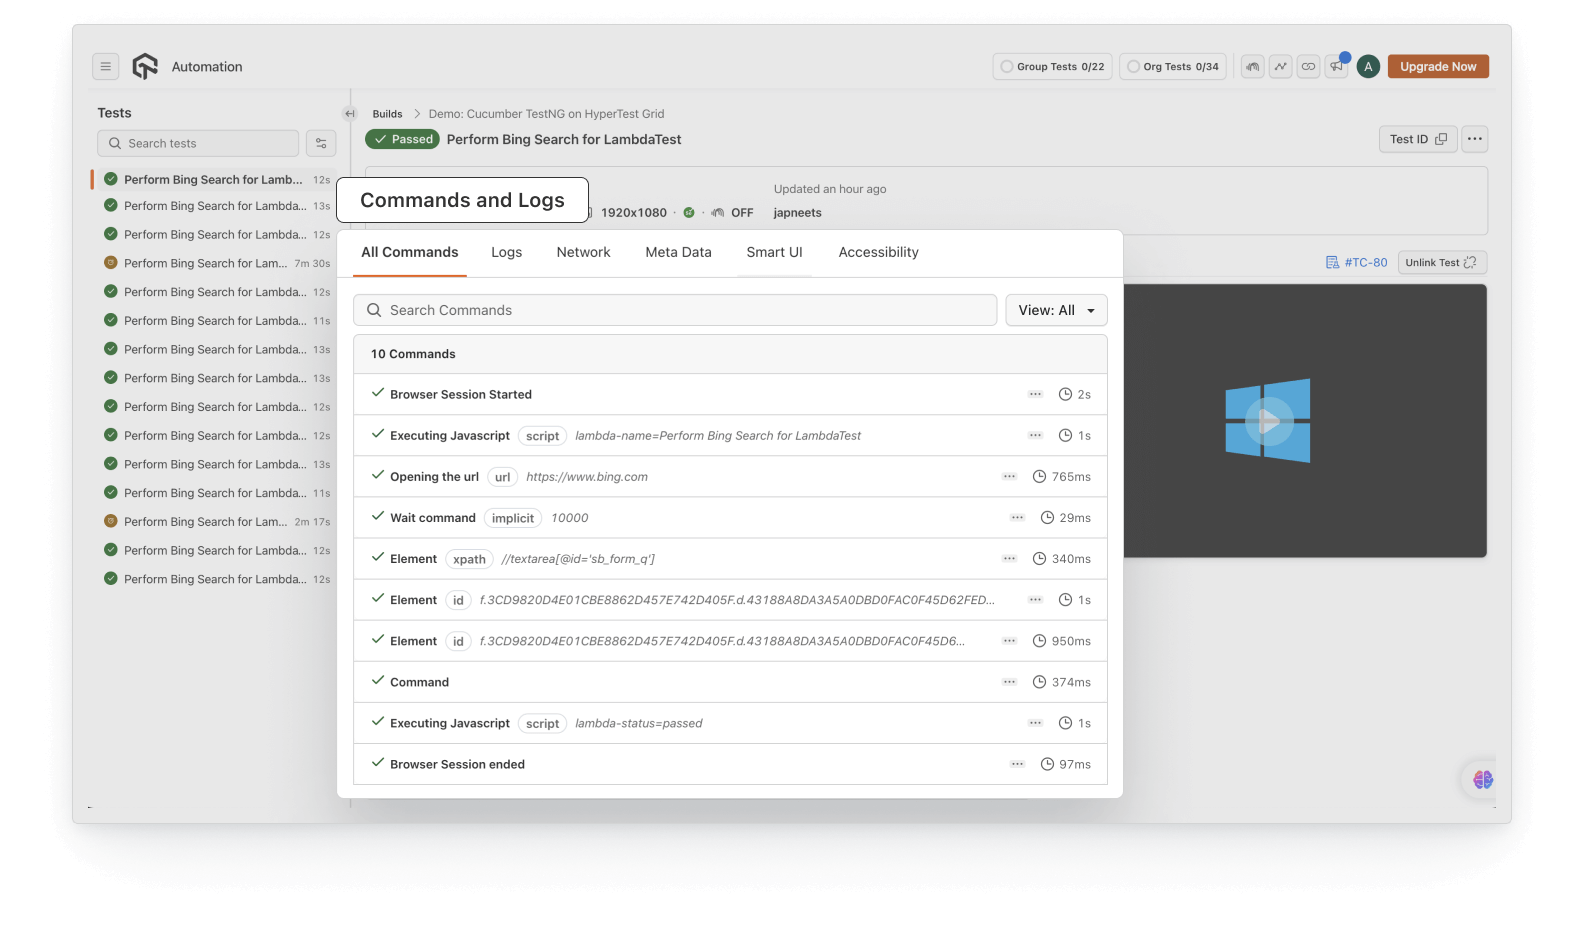
Command Logs and Network
View every command executed during the test and all associated logs.
The right panel contains three tabs:
- All Commands - Every Selenium command that ran during the test. Hover on a command to see its parameters.
- Logs - Toggle between Console Logs, Terminal Logs, and Test Framework Logs.
- Network - View all network requests and responses captured during execution.
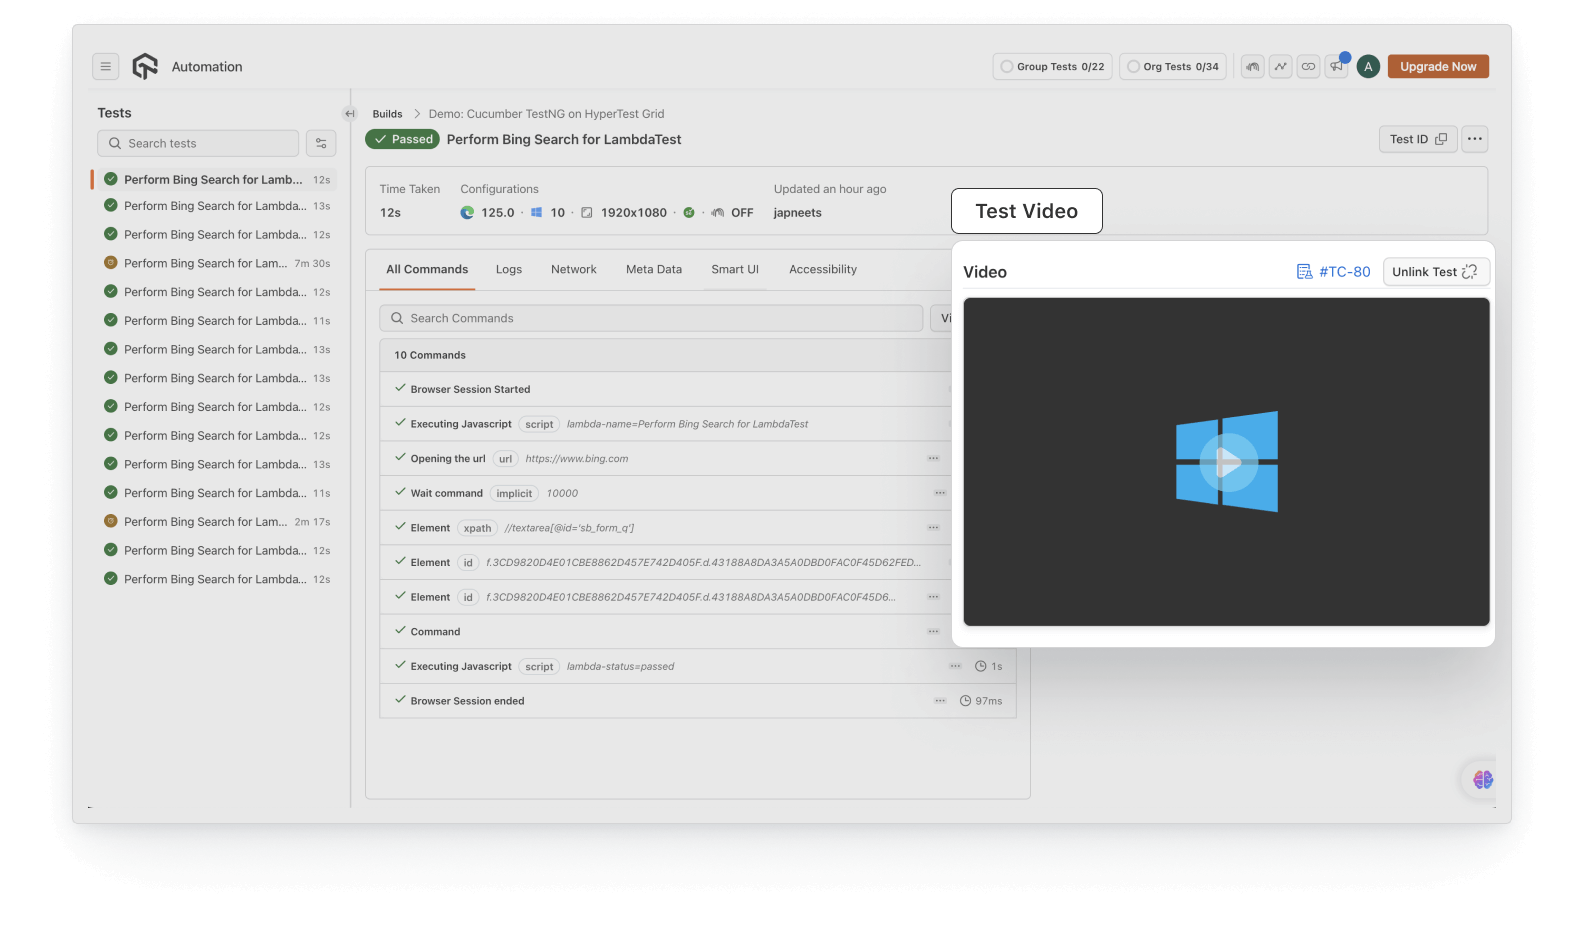
Video Recording
Watch a full video playback of your test execution to see exactly what happened in the browser.
Next Steps
Now that you know how to read the dashboard, explore more ways to manage and debug your tests.
- Filter your tests - narrow down results by browser, OS, status, or tags
- Share test results - send results to teammates
- Mark as bug - file a bug directly from a test session
- Debug your tests - enable extended logging for deeper analysis
- Group tests with tags - organize tests using custom tags
