Organisation Summary Dashboard in HyperExecute
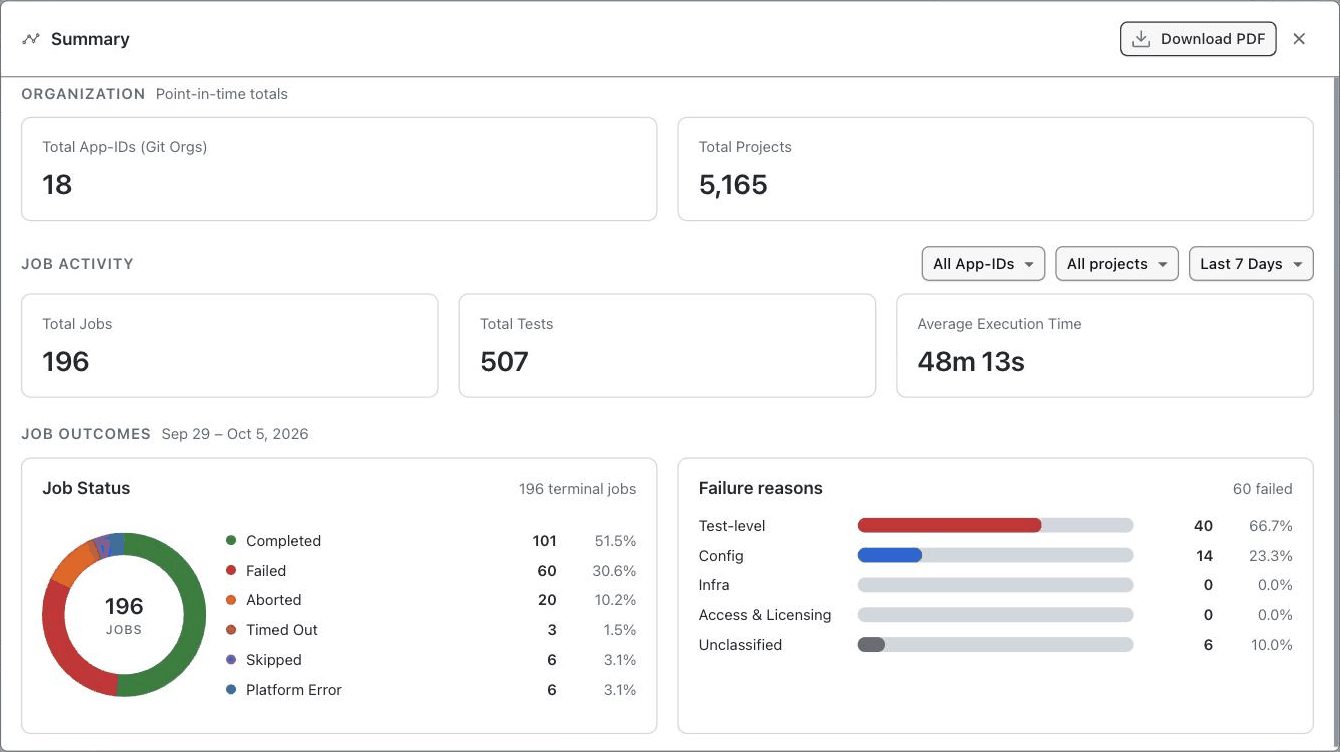
The Organisation Summary Dashboard gives you a single view of how your whole organisation uses HyperExecute. It covers how many App-IDs and projects exist, how many jobs and tests ran in a chosen time window, how those jobs ended, and why the failed ones failed. Instead of opening jobs one by one, you get a health check across every team and project, which you can export as a PDF.
| At a glance | |
|---|---|
| Who it's for | Organisation admins |
| Plan | Enterprise only |
| Where to open it | HyperExecute → Projects → View Summary |
| What you get | KPI tiles, a job status donut, a failure-reason breakdown, a PDF export |
| Filterable by | App-ID, project, time window (7 / 14 / 30 days, custom, or all time) |
The Organisation Summary Dashboard is an enterprise-only feature. Contact your account team or 24×7 chat support to enable this for your organization.
Within an enterprise org, only organisation admins can open the dashboard. The View Summary button sits at the top of the HyperExecute Projects list.
To open it, go to HyperExecute → Projects and click View Summary at the top of the project list. The dashboard opens in a Summary dialog.
What the dashboard shows
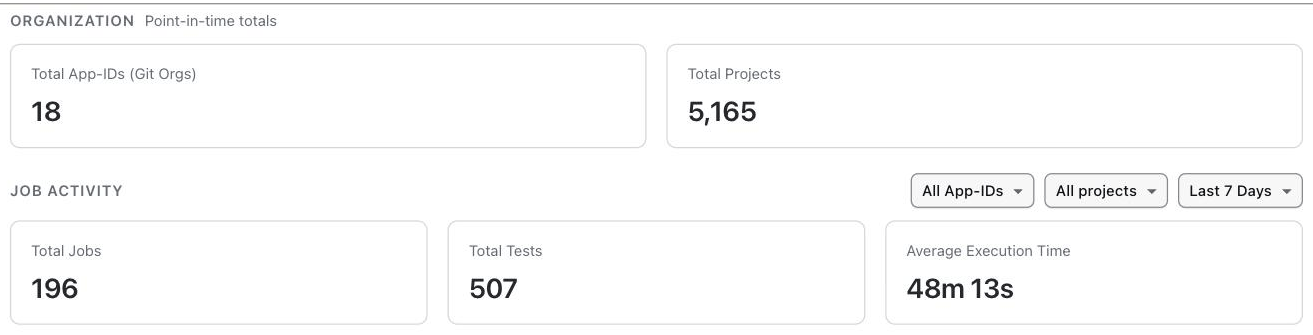
The dashboard splits into three sections, with filters that apply only to the ones that are time-sensitive.
Organization totals (point-in-time)
Not affected by the time window.
| Tile | What it counts |
|---|---|
| Total App-IDs (Git Orgs) | Git organisations connected to your HyperExecute organisation |
| Total Projects | HyperExecute projects in your organisation |
Job Activity (filtered by App-ID, project, and time window)
Change any filter above the tiles and these values recompute.
| Tile | What it measures |
|---|---|
| Total Jobs | HyperExecute jobs that reached a terminal (finished) state in the selected window. Matches the "N terminal jobs" count on the Job Status card. |
| Total Tests | Tests run across those jobs |
| Average Execution Time | Average time a job took to run in the selected window |
Job status at a glance
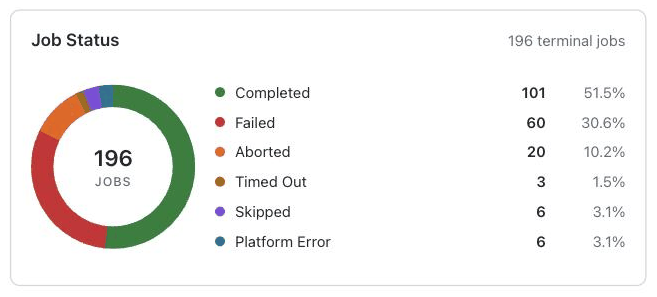
The Job Status card shows how jobs in the selected window ended. The number in the centre of the donut, and the "N terminal jobs" count beside the card header, is the total of all slices below. Each slice shows a job count and its share of that total.
| Status | What it means |
|---|---|
| Completed | The job finished running. For test-level outcomes inside a Completed job, see HyperExecute Status. |
| Failed | The job did not finish successfully. Broken down further in the Failure reasons card. |
| Aborted | The job was stopped before it finished, either by a user action or by a stop-on-failure rule like failFast. |
| Timed Out | The job did not complete within its allowed execution window. |
| Skipped | The job was not executed. The test-level definition is "not relevant or cannot be executed due to some issues like environment setup, data, or configuration". |
| Platform Error | The job failed because of a HyperExecute platform-side issue, not something in the user's test or configuration. |
Failure reasons
The Failure reasons card breaks down the failed jobs by cause, so you can tell at a glance whether failures are coming from the tests themselves or from everything around them.
The header shows the total number of failed jobs. Each category below has its own bar with a job count and share of the failures.
| Category | What it typically covers |
|---|---|
| Test-level | Failures inside the user's own tests: assertions, uncaught exceptions, application bugs |
| Config | Mis-configured YAML, bad task definitions, missing env vars, invalid caching setup |
| Infra | Platform infrastructure the job depends on: browser/device grid, network, storage |
| Access & Licensing | Missing permissions, expired licenses, seat or concurrency limits |
| Unclassified | Failures that didn't fit any of the above buckets |
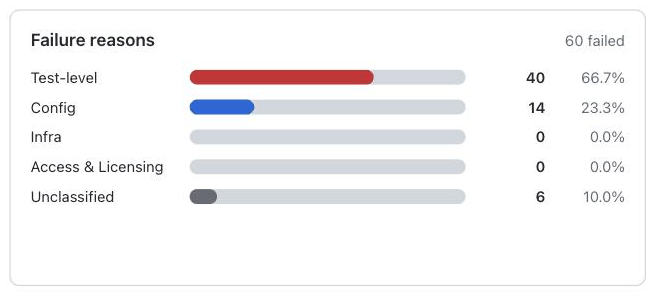
If Test-level dominates, your developers own the fix. If Config, Infra or Access & Licensing dominate, the fix is almost always a platform or policy change. Raise it with the owning team rather than asking every project to patch around it.
Choosing a time window
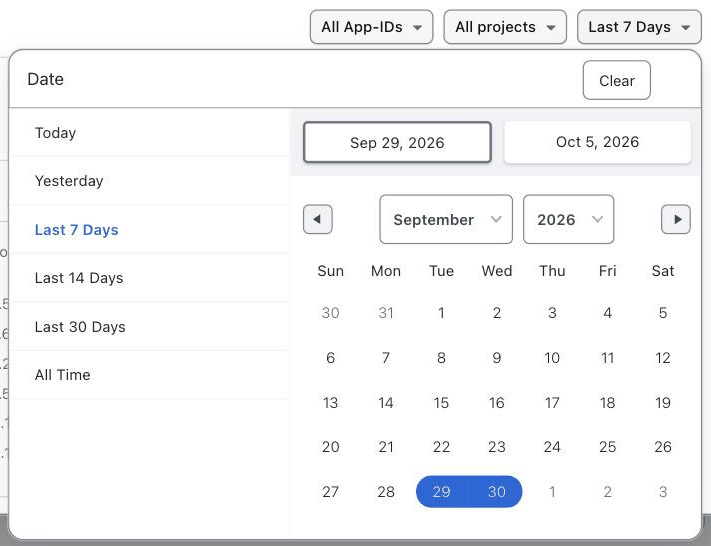
The time window selector sits next to the App-ID and project filters in the Job Activity section. The dashboard opens on Last 7 Days. The date range in use is shown next to the Job Outcomes heading.
Click the selector to pick a preset or a custom range:
| Preset | Window |
|---|---|
| Today | The current day |
| Yesterday | The previous day |
| Last 7 Days (default) | Trailing 7 days ending today |
| Last 14 Days | Trailing 14 days ending today |
| Last 30 Days | Trailing 30 days ending today |
| All Time | Every job your organisation has ever run |
| Custom range | Pick any start and end date from the calendar |
Click Clear to reset the selection. The window applies to Job Activity and Job Outcomes. Organization totals are point-in-time values and do not change with the window.
Exporting to PDF
Click Download PDF in the top-right corner of the Summary dialog to download the dashboard as a PDF.

Frequently asked questions
Who can access the Organisation Summary Dashboard in HyperExecute?
The Organisation Summary Dashboard is available to organisation admins on the enterprise plan. Users on other plans or non-admin roles cannot open it. To enable the enterprise plan, contact your account team or 24×7 chat support.
Where do I open the Organisation Summary Dashboard?
Go to HyperExecute → Projects and click the View Summary button at the top of the project list. The dashboard opens in a Summary dialog on the same page.
What time windows can I filter the dashboard by?
Today, Yesterday, Last 7 Days (the default), Last 14 Days, Last 30 Days, All Time, or a custom start and end date. The window applies to the Job Activity and Job Outcomes sections only. Organization totals (App-IDs and Projects) are point-in-time values and do not change with the window.
Can I export the Organisation Summary Dashboard as a PDF?
Yes. Click Download PDF in the top-right corner of the Summary dialog to download the dashboard as a PDF.
What job statuses does the dashboard show?
The Job Status donut groups terminal jobs into six statuses: Completed, Failed, Aborted, Timed Out, Skipped, and Platform Error. Each slice shows the job count and its share of the total. See Job status at a glance for one-line definitions.
What failure categories does the dashboard track?
Failed jobs are broken down into Test-level (failures inside the user's own tests), Config (YAML or task mis-configuration), Infra (platform infrastructure the job depends on), Access & Licensing (permissions, licenses, seat limits), and Unclassified. See Failure reasons for the typical contents of each category.

 Chat with Us