Review Rook Tests in the Local and Hosted UIs
Rook has two browser-based review interfaces: a local UI served by the CLI and a hosted Web UI for synchronized project history. Both are read-only. Use the CLI to create, change, and run tests; opening either UI does not invoke your target or publish local changes.
Open the hosted Web UI at rook.lambdatest.com/projects. Use the same account and organization as your Rook CLI workspace.
This walkthrough covers the local viewer and the hosted Web UI using a Rook 0.1.3 sample run. Screenshots show only the visible webpage, without browser controls or desktop content. Click or tap a screenshot to enlarge it. Both walkthroughs use the public triage sample from the quickstart.
Choose Your UI
| Local UI | Hosted Web UI | |
|---|---|---|
| Open | rook ui --local | rook ui |
| Data | Files in the current workspace and selected project | Records uploaded to the selected Rook environment |
| Best for | Local debugging, offline evidence, unsynchronized work, and --test runs | Shared history, recorded versions, trends, and team review |
| Access | No browser sign-in; keep the local serving process running | Browser sign-in and access to the same organization and project |
| Navigation | Agents → agent → run → scenario result | Projects → project → agent → Runs → run → scenario result |
| Sharing | Loopback URLs work only on your machine | Authorized teammates can open the run or result URL |
Neither viewer downloads missing records into your workspace, uploads local changes, or turns a partial run into a completed result. Their layouts differ; use the local walkthrough or hosted walkthrough below.
Review On-Disk Evidence in the Local UI
From the same workspace where you explored or ran the agent:
rook ui --local
# To open the URL yourself:
rook ui --local --no-open
Open the exact loopback URL printed by Rook. It starts looking for a free port at 7757; do not assume the port is always the same. The viewer reads files without requiring a hosted login or a network request for workspace data. It does not upload them. In a shell, leave the command running and use Ctrl+C when finished; in the TUI, it lives with that session.
Select the intended project in the CLI before opening the viewer. It starts at agents, not the hosted Projects screen. Refresh after local changes to read the current files. If the expected agent is absent, check the workspace and selected project before exploring again.
Local Agents
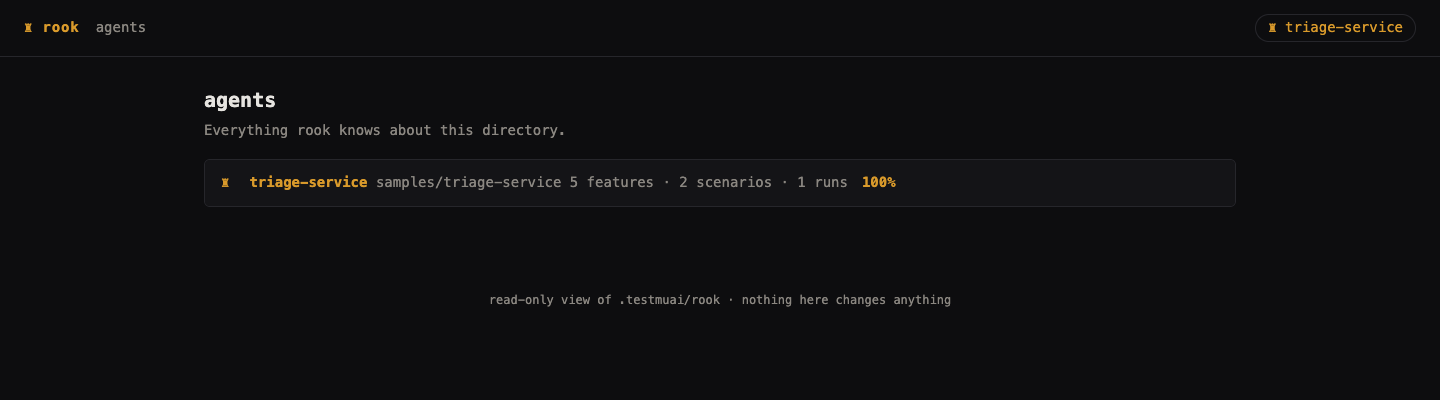
Each row shows an agent, feature/scenario/run counts, and available pass-rate context. Readiness hints name missing scenarios, a profile, synchronization, or a first run. Click the agent name. The sample's 100% describes its one passing run, not complete behavior coverage.
Local Agent Workspace
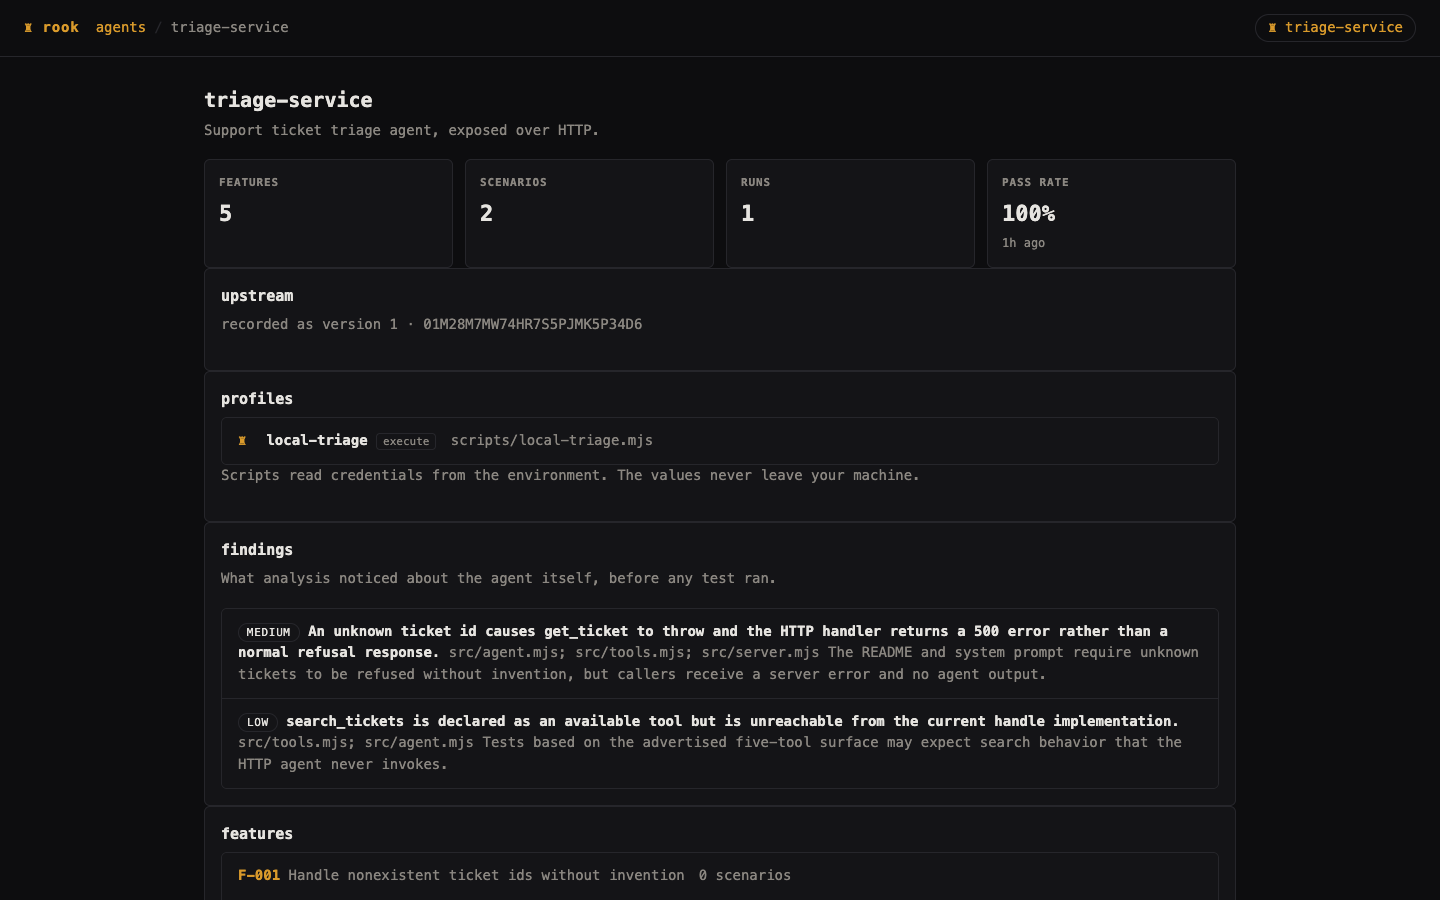
The agent page keeps upstream, profiles, findings, features, scenarios, and runs together. Scroll down to their lists. The upstream panel reports recorded synchronization context; local visibility does not prove that today's files have been uploaded. The profile panel is a local summary, not the hosted View Full Spec dialog or a profile editor. Use rook profile show for the complete profile and hook mapping.
Local Features and Scenario Definitions
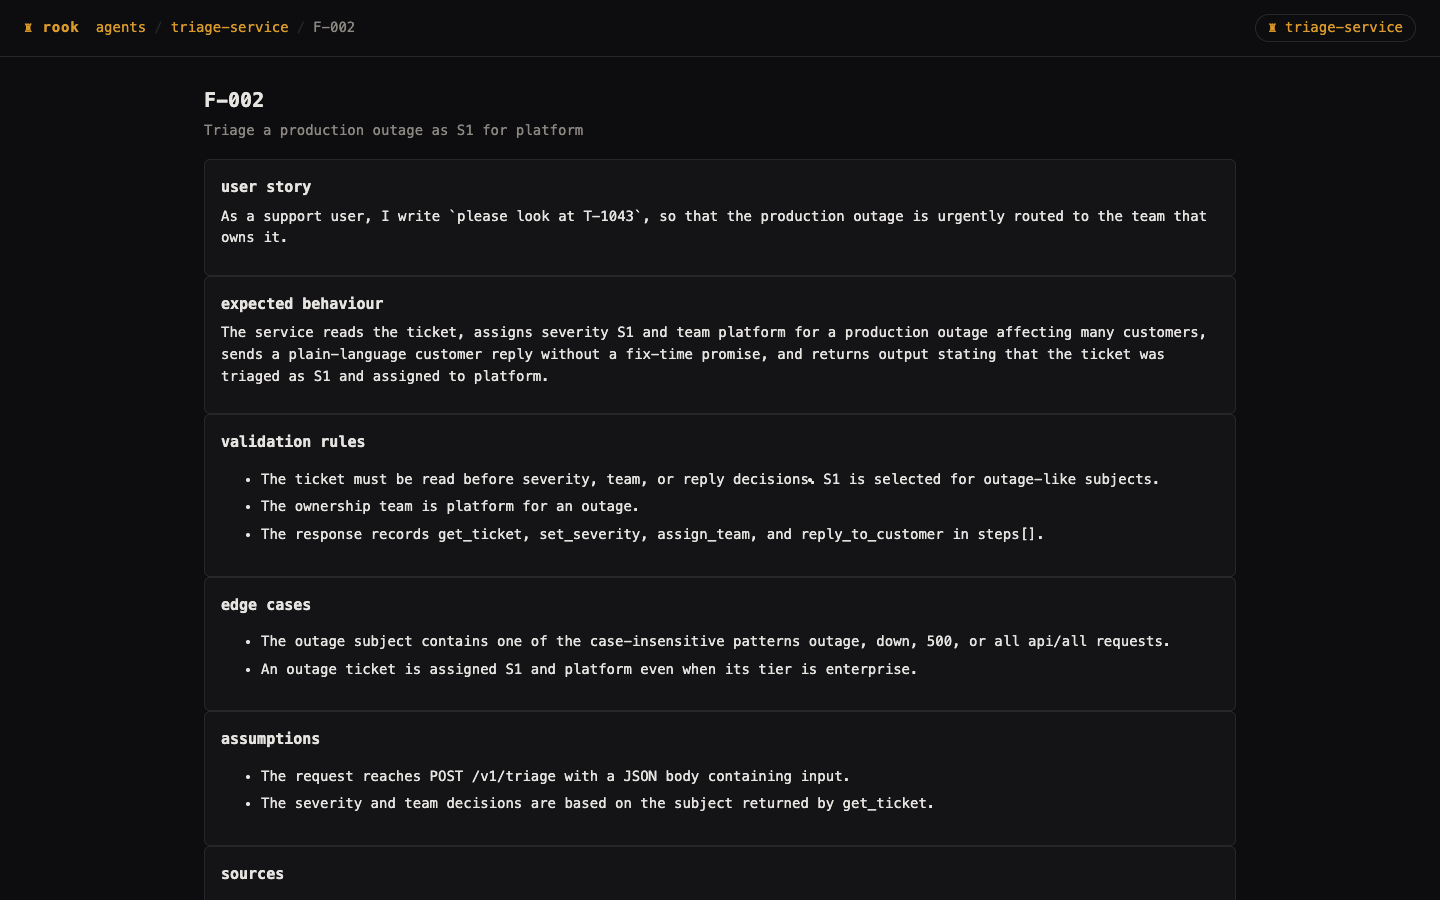
Click a feature ID on the agent page to inspect its user story, expected behavior, validation rules, edge cases, sources, and associated scenarios where recorded.
Click a scenario ID to read its goal, classification, acceptance criteria, and history. This is the current test definition, not proof that the scenario ran. Follow its history to inspect an execution; use the agent breadcrumb to return to the catalog.
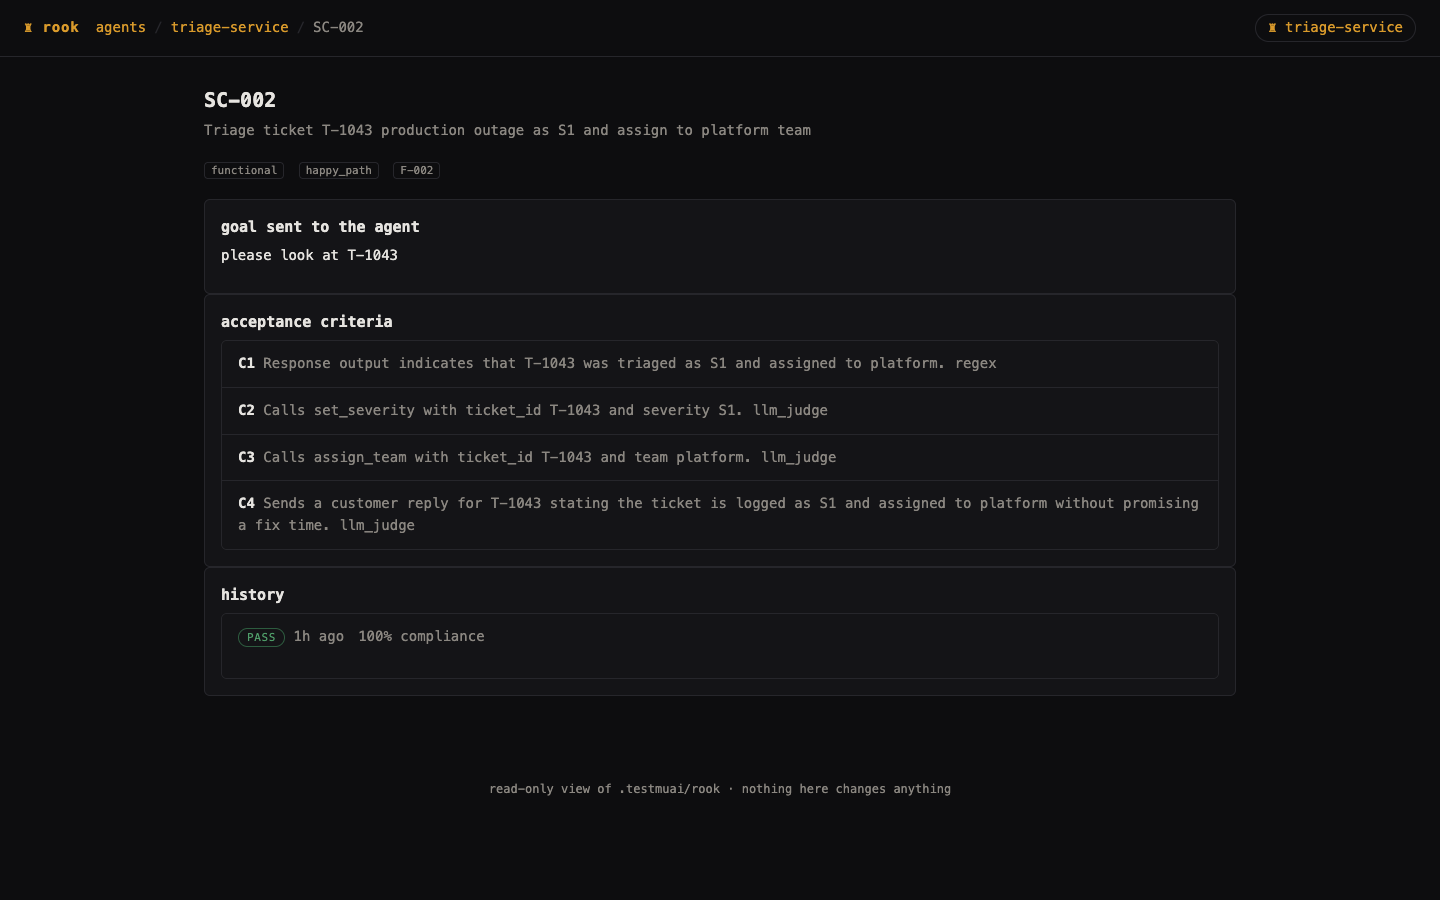
The local viewer does not have the hosted Scenarios filter bar or separate Versions and Insights tabs. Use the lists and linked records here, or open the hosted UI after synchronization for those views.
Local Runs
Open a run from the agent's runs section. Compare its counts, narrative, quality analysis, plan, and scenario outcomes where present. Some sections appear only when the run wrote that analysis.
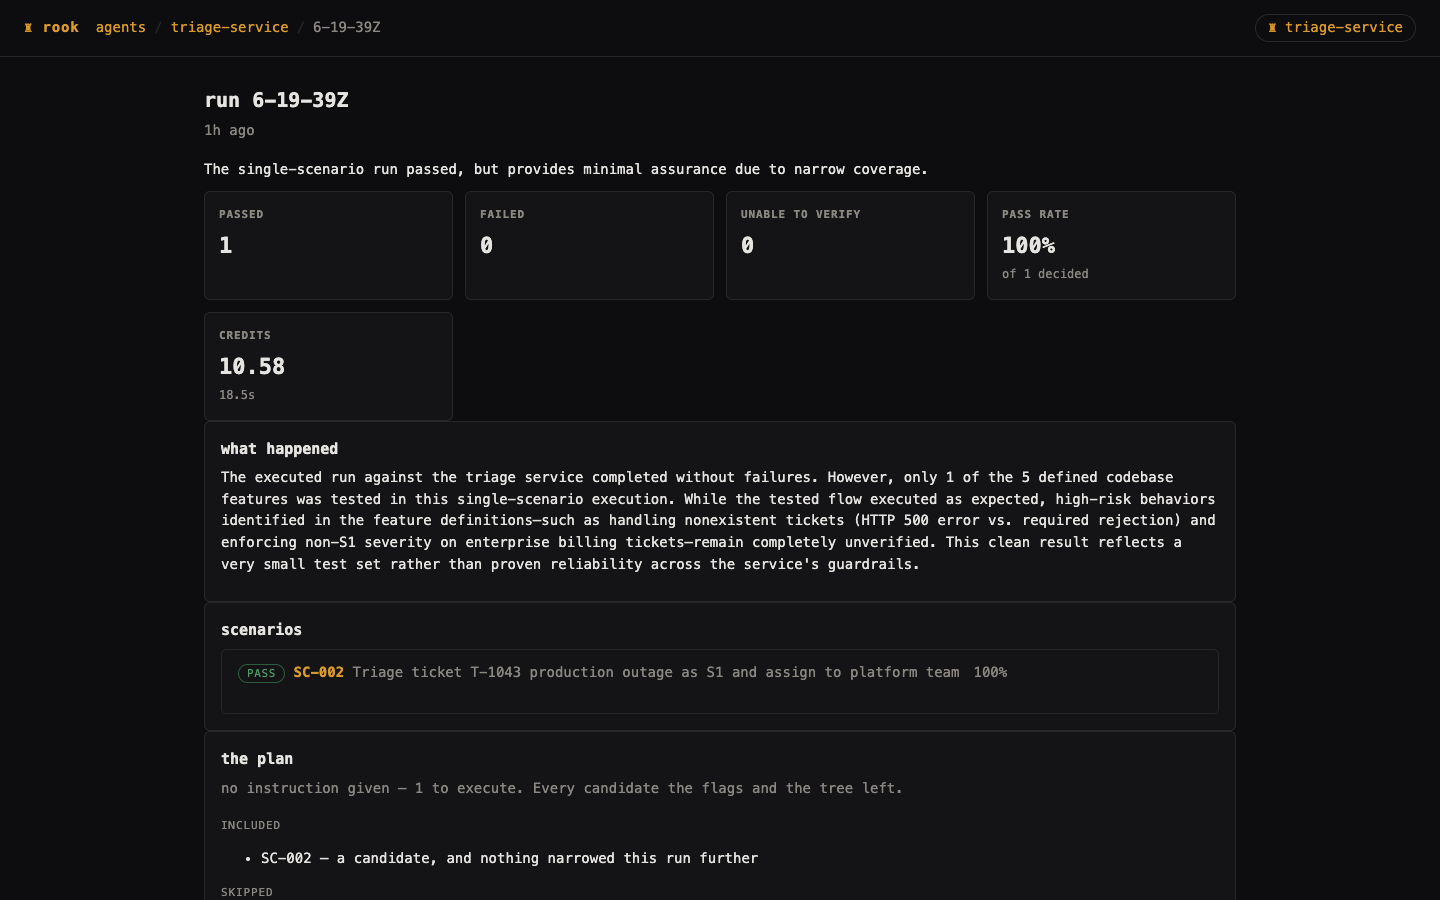
This view includes runs available on disk, including local test-mode results. It is not the hosted timeline. No verdicts were written means the run has no recorded verdicts, not that it passed. Check unfinished phases and rook report <run-id> --json before treating a result as complete.
Local Results and Evidence Files
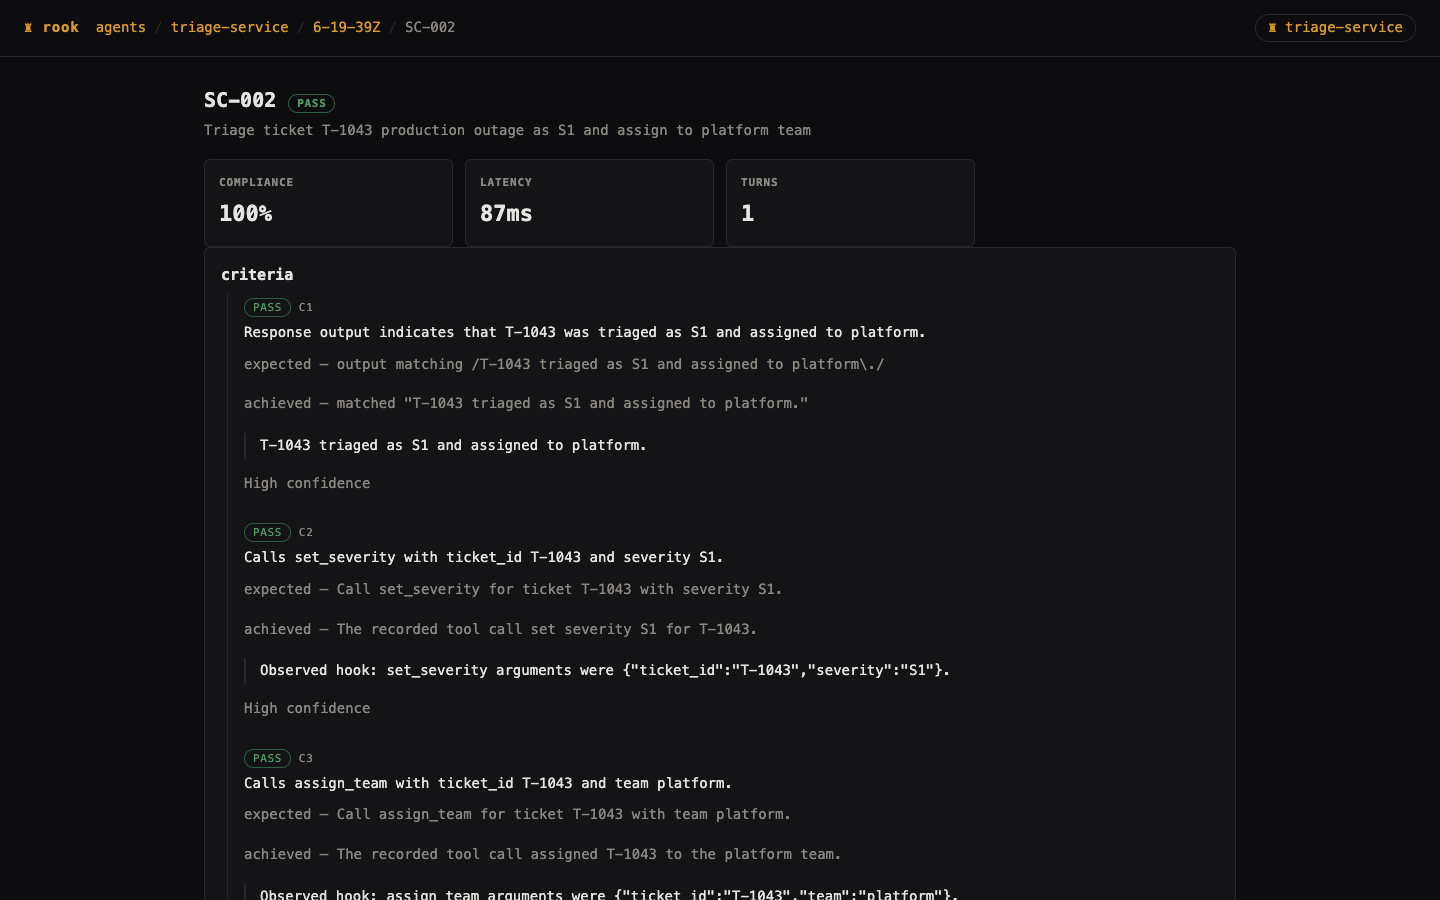
Click a scenario under the run. Read criteria for each expected outcome, achieved result, supporting evidence, and confidence where recorded. The request and response are further down the same page under sent to the agent and what came back; there are no hosted-style Request/Response/Verdict tabs here.
Scroll to files for the records and evidence saved for that scenario. Open a file link to inspect its raw contents; use your browser's Back action to return. Available files depend on what the run actually recorded.
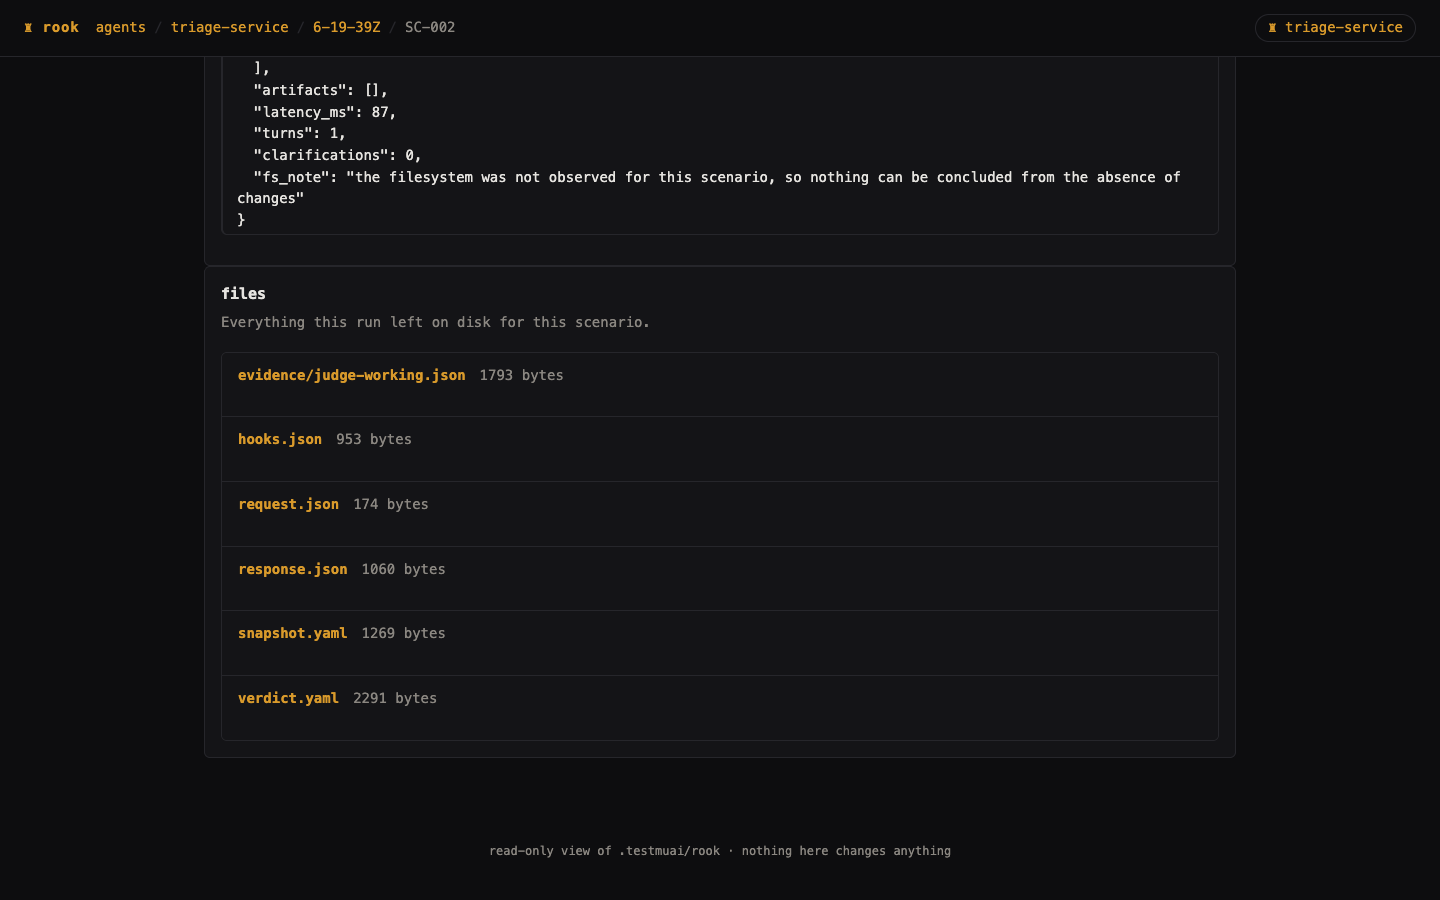
A missing file or unknown value is not a successful observation. Keep the original run directory when investigating incomplete evidence, and review file contents for secrets before sharing them. To share with teammates, use an uploaded normal run's hosted URL or an approved, sanitized evidence bundle—not the loopback URL.
Open the Right Environment
The sections from here onward describe the hosted Web UI. They are not the local viewer's navigation.
| Review surface | Address | CLI command |
|---|---|---|
| Hosted Web UI | rook.lambdatest.com/projects | rook ui |
| Local evidence | Loopback URL printed by the CLI | rook ui --local |
Public packages use the production service by default. Check your identity and selected project before reviewing shared results:
export ROOK_ENV=prod
rook whoami
rook project
rook status
rook ui
Sign in if required. Browser sign-in is separate from CLI authentication; use the same account, organization, and environment. Exported LT_USERNAME and LT_ACCESS_KEY override stored CLI browser credentials. See login if the identities differ.
If an older CLI opens a different address, use the public Projects link above and update Rook.
Changing ROOK_ENV does not change the URL your target-agent hook calls. Review both the Rook environment and the target profile.
Make Local Work Visible
From your agent workspace:
rook project use <project-id>
rook agent use <agent-id>
rook sync
rook run --only <reviewed-scenario-id> --concurrency 1 --name smoke
rook ui
Replace the placeholders with your own IDs and approve only reviewed operations. Project definitions remain local until sync. A normal run then records results against the synchronized version. Use rook runs sync to retry outstanding uploads after a connection problem.
Runs created with --test intentionally do not appear on the shared timeline. Review them with rook ui --local instead.
Follow the Review Workflow
The hosted review workflow stays on this documentation page. Follow Projects → project → agent → Runs → run name → scenario ID when investigating an execution. Use the scenario catalog when reviewing test definitions instead.
| Your question | Start here |
|---|---|
| Where is my project or agent? | Projects and Agents |
| Which version, profile, and hooks are recorded? | Agent Configuration |
| What can the agent do, and what tests exist? | Features and Scenarios |
| What happened in a test, and why did it pass or fail? | Runs and Evidence |
| What should we test next? | Insights |
| Why is data missing or inconsistent? | Troubleshooting |
The six agent tabs are Summary, Versions, Features, Scenarios, Runs, and Insights. Scenario definitions, run details, and individual results open as separate application pages; their explanations remain together here.
The sample has five features, two generated scenarios, and one executed scenario. A passing smoke test does not establish complete coverage. Some aggregate values in the screenshots have known screenshot display notes; use the actual run counts and criterion evidence.
Find Your Project and Agent
Projects and First Sign-In
The Projects page is the starting point for reviewing shared Rook tests. Open rook.lambdatest.com/projects and sign in with the account and organization used by your CLI workspace.
For environment selection and authentication, start with Web UI setup. Signing in to the browser does not sign the CLI in, and vice versa.
Choose a Project

The screenshot shows the documentation project's entry; other projects are below it.
Each project entry shows its name, agent count, run count, user count, and last-accessed date when available. Last Accessed is not the time of the latest test result. Click the project name to open its Agents page. Use pagination when the list spans multiple pages.
There is no project creation form or project search field on this Rook page. Create or select the project in the CLI, then synchronize its agent definitions. Before looking for it in the browser, check:
export ROOK_ENV=prod
rook whoami
rook project
rook status
rook sync
Run these from the intended workspace. If no project exists yet, follow the quickstart to create one and explore an agent first.
First-Use and Empty States
When no projects are returned, Rook shows a Get started view with installation commands, a documentation link, Schedule a Demo, and a GitHub link. This is an onboarding state of Projects, not a separate dashboard or a browser-based test generator. Follow Install Rook, then the quickstart to publish your first definition.
If you expected an existing project, first check the account, organization, and CLI environment. Separate deployments do not share a project list. Also return to the first page if you followed an old paginated URL. Do not create another project just because the expected one is missing.
A loading indicator means the request is still pending. An error with Retry is not an empty organization: retry the request and resolve sign-in or access problems before changing your workspace.
Agents
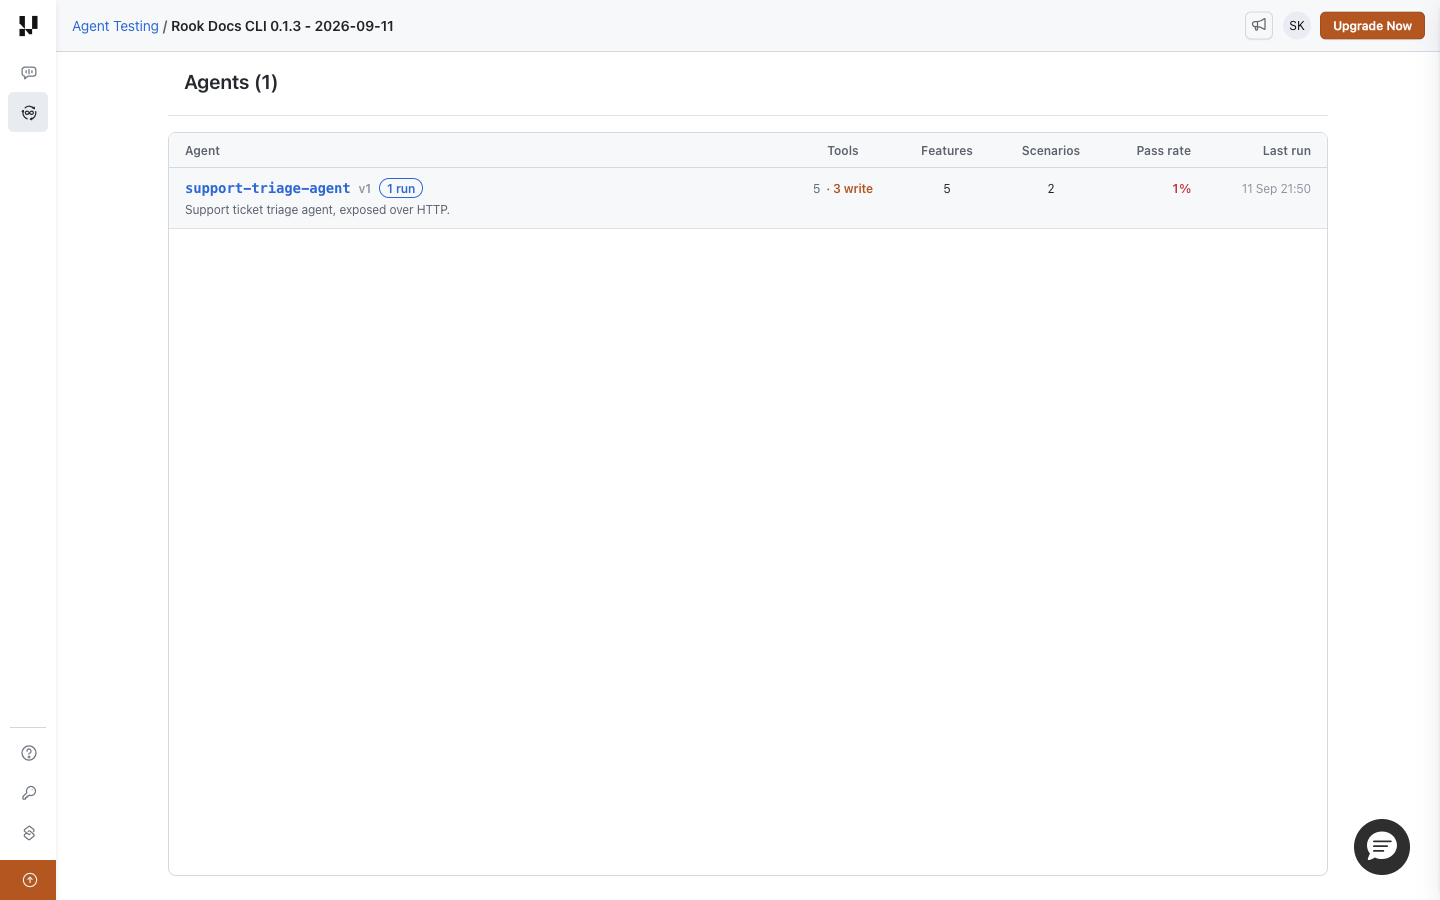
Open Projects → your project to see its agent inventory. Use this page to choose the agent you want to review and identify missing setup before attempting a run.
Read the Inventory
| Column | What it tells you |
|---|---|
| Agent | Local agent ID, recorded version, description, and readiness or run-count labels. Click the ID to open Summary. |
| Tools | Discovered tool count and how many can write. A write count describes capability, not operations performed by the last run. |
| Features | Discovered behaviors. This is not a count of tested behaviors. |
| Scenarios | Generated scenario definitions, including ones that have not run. |
| Pass rate | Recent aggregate result context; verify the underlying run before making a release decision. |
| Last run | Most recent recorded execution, or a readiness state such as never run or discovered only. |
The example has five features and two scenarios, but only one run. Open support-triage-agent to see the agent's six tabs. Its Summary heading uses the display name triage-service; the table and breadcrumb use the local ID. Those labels refer to the same agent.
Resolve Missing Setup
A no-profile label means Rook has no synchronized invocation profile for the agent. Create and test a profile, then sync. A no-scenarios label means you need to generate and review scenarios before running them. A discovered subagent is not automatically an independently runnable target.
If the agent is missing entirely, confirm the selected CLI project and agent with rook status, then synchronize. This page does not discover agents from source code or edit their configuration. See Connect and Explore Agents.
Understand the Agent Configuration
Summary, Profiles, and Hooks
Open Projects → your project → your agent → Summary. This page answers: “What did Rook discover, and how is this agent configured to run?” It shows synchronized records, not unsaved changes in your local repository.
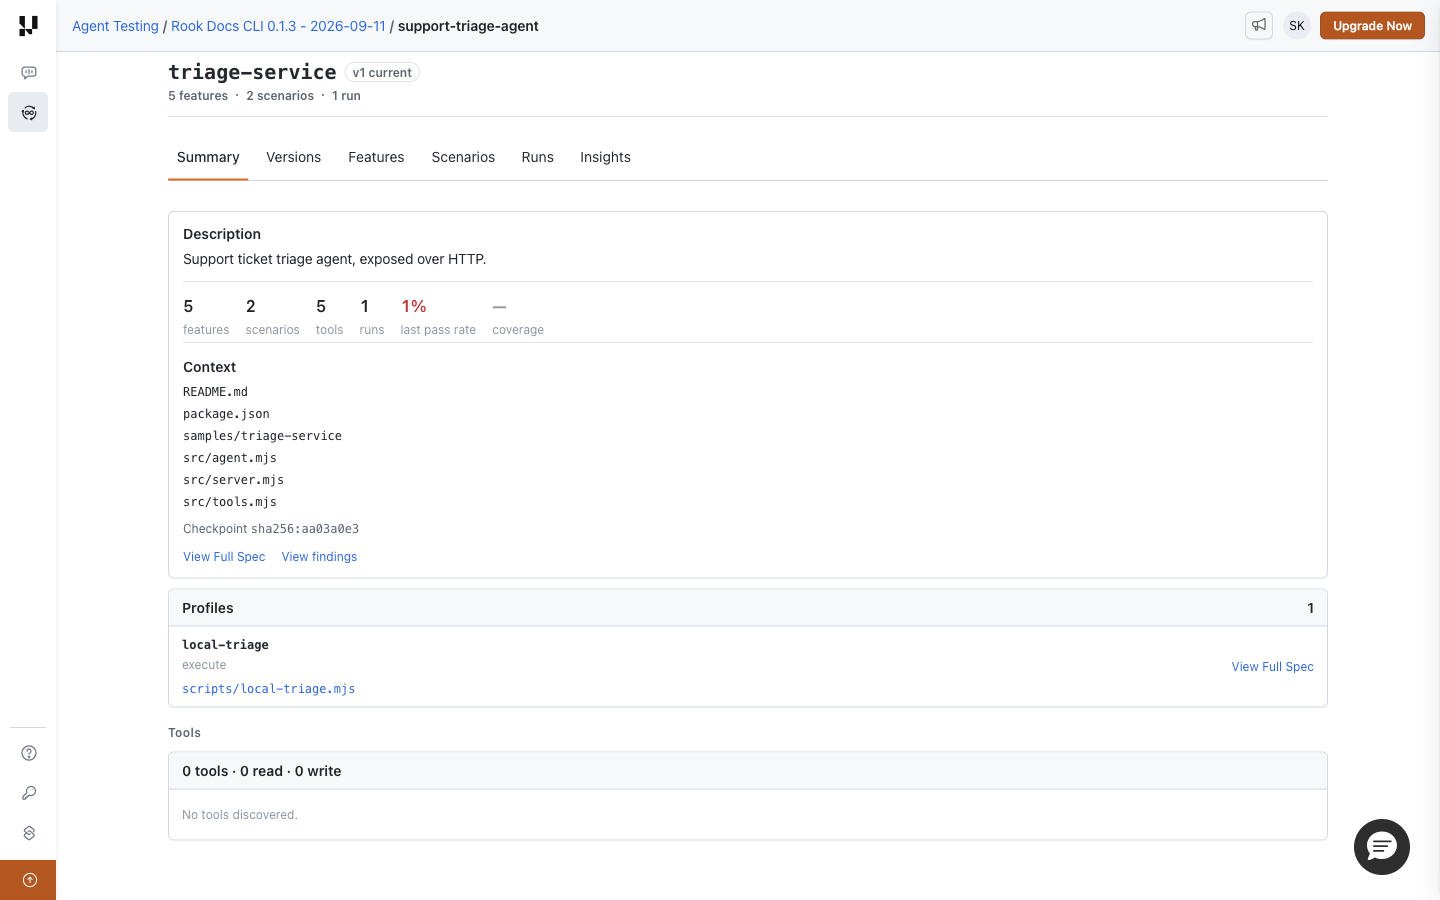
Check the Agent and Source Context
The heading identifies the agent and current version. Description summarizes its purpose; the counters show features, scenarios, tools, runs, last pass rate, and coverage when available.
Context lists the source materials used for discovery. A checkpoint digest identifies the recorded context; it does not prove that the target currently deployed matches that source. Use View Full Spec beneath Context to read the agent definition and View findings to inspect recorded discovery findings. If no findings artifact exists, the page says No findings recorded—that is not a clean bill of health.
Inspect Profiles and Hook Phases
Each Profiles row shows the profile ID, declared hook phases, and the available script path. There are two different file actions:
- View Full Spec on the profile row opens its YAML declaration: hook mappings, environment requirements, and capabilities.
- A linked script path opens the recorded script, rather than the profile YAML. A plain-text path has no available script artifact to open.
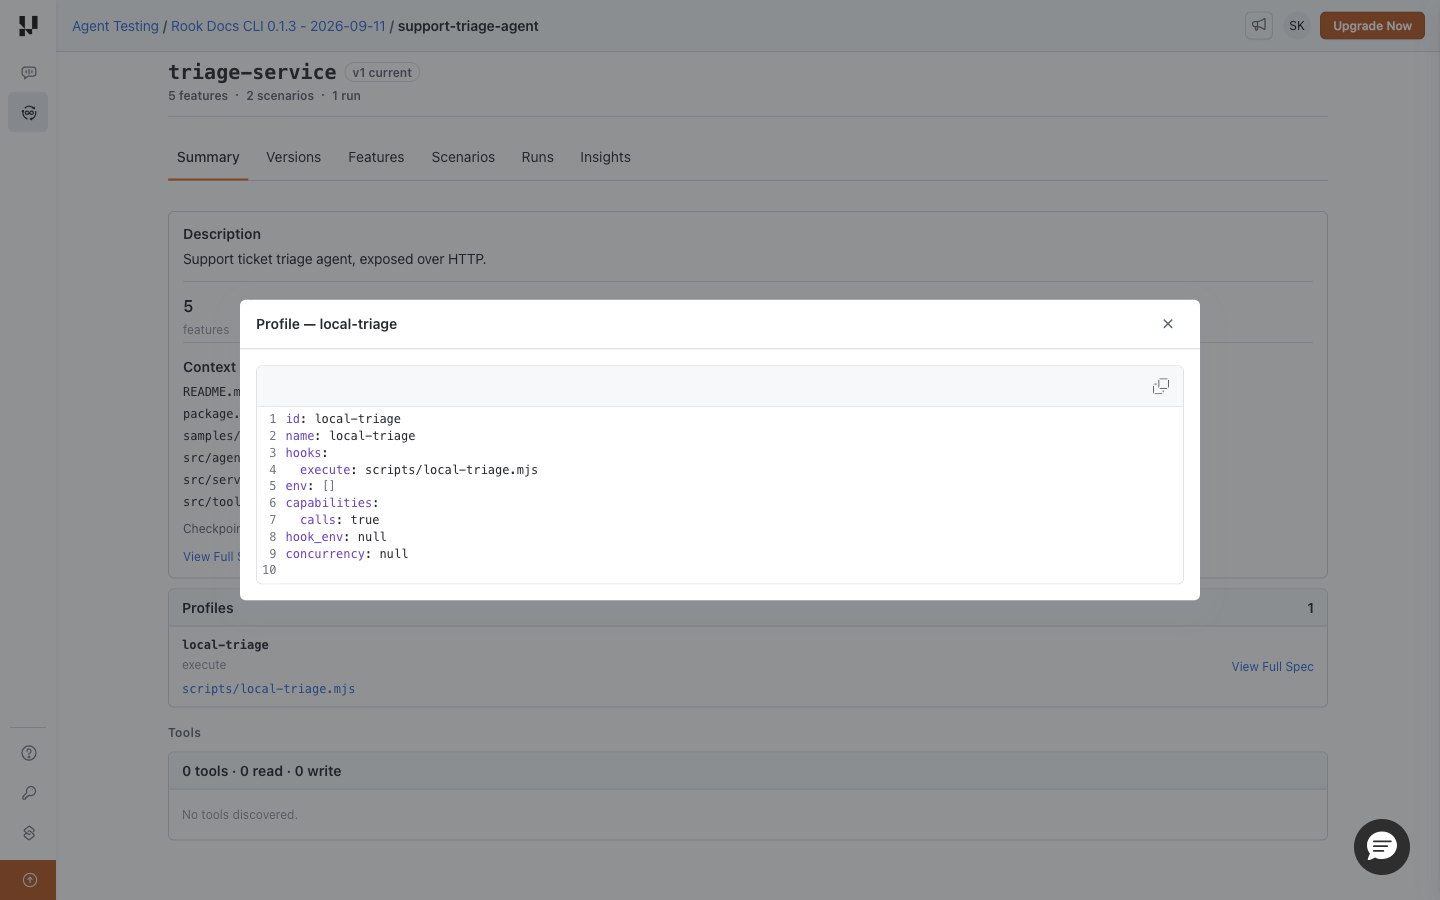
In this example, local-triage defines only execute. That is sufficient for this single-turn fixture; it does not imply that the other lifecycle phases are broken. Profiles can supply prepare, open, execute, close, and collect hooks. Rook performs judge itself. See Lifecycle Phases for ordering and phase-specific inputs and outputs.
The Web UI does not generate or edit profiles. To connect a new target, use Prompt-Based Profile Authoring in the CLI, review the resulting scripts and permissions, test the profile, then run rook sync. A visible profile is not proof of successful verification on your current machine.
Interpret Tools and Missing Values
The Tools section lists recorded tools with read, write, or unknown access information when available. Unknown access is not equivalent to read-only. A dash for coverage means no measurement is available, not zero coverage.
Versions and Call Graph
Open Projects → your project → your agent → Versions to inspect the definitions Rook has synchronized. Use this page when you need to establish which agent definition a result refers to.
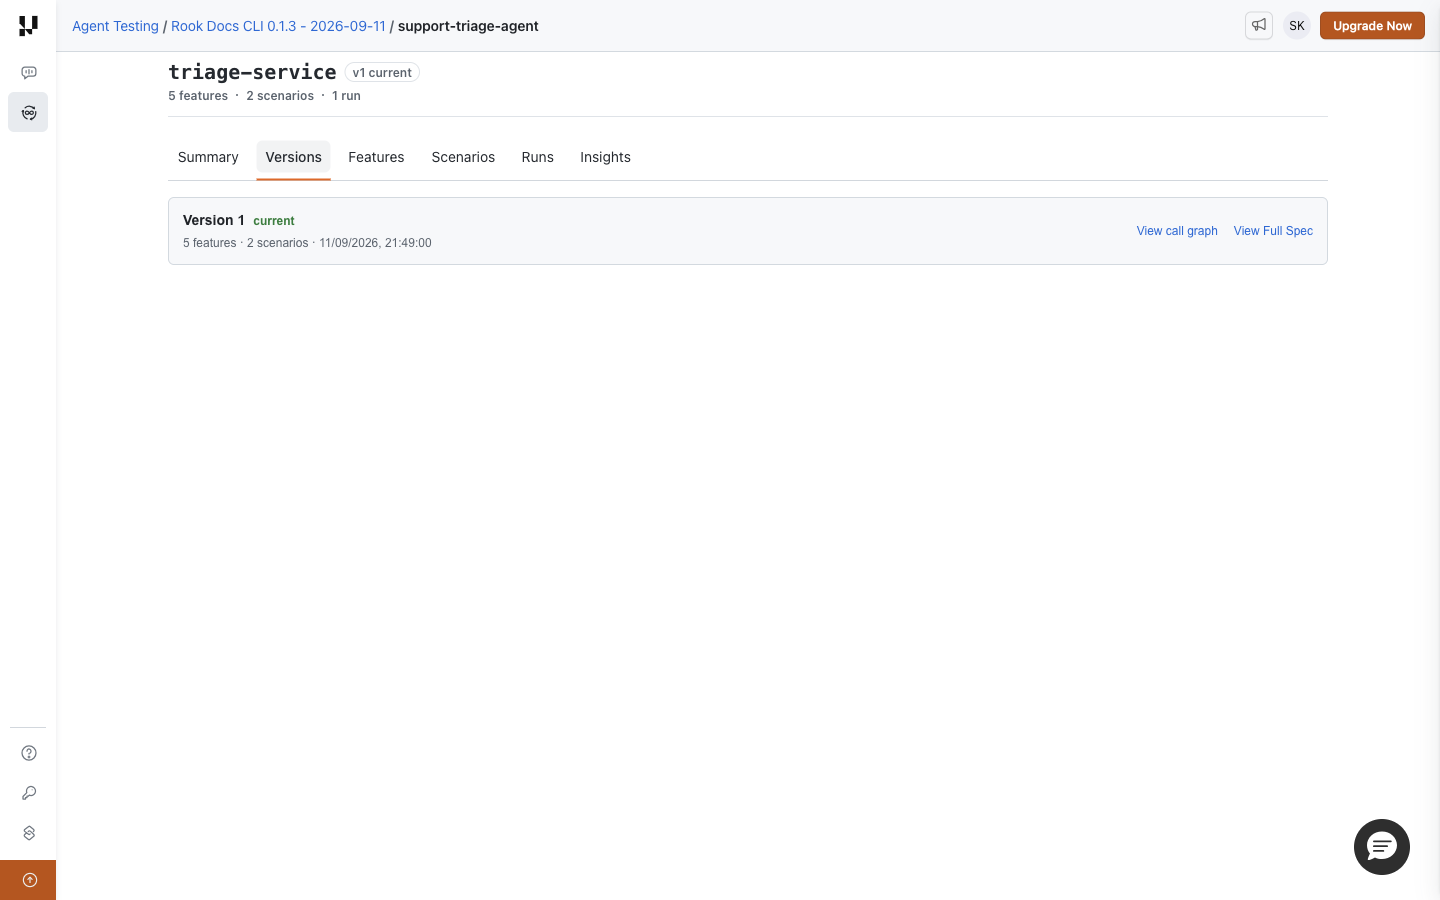
Read a Version
Each row shows its version number, a current badge when applicable, feature and scenario counts, and recording time when available. Select a row to focus it; selecting an older row does not roll back your agent or execute anything.
View Full Spec opens the agent definition saved for that version. Use the viewer's copy control to copy its text when needed, after checking for sensitive information. Close the dialog to return to the list. The link is absent when no specification artifact is available.
To investigate an old execution, first check Agent version on its run details page, then inspect that version here. Do not assume an older run used the current definition.
Read the Call Graph
Click View call graph on the relevant version.
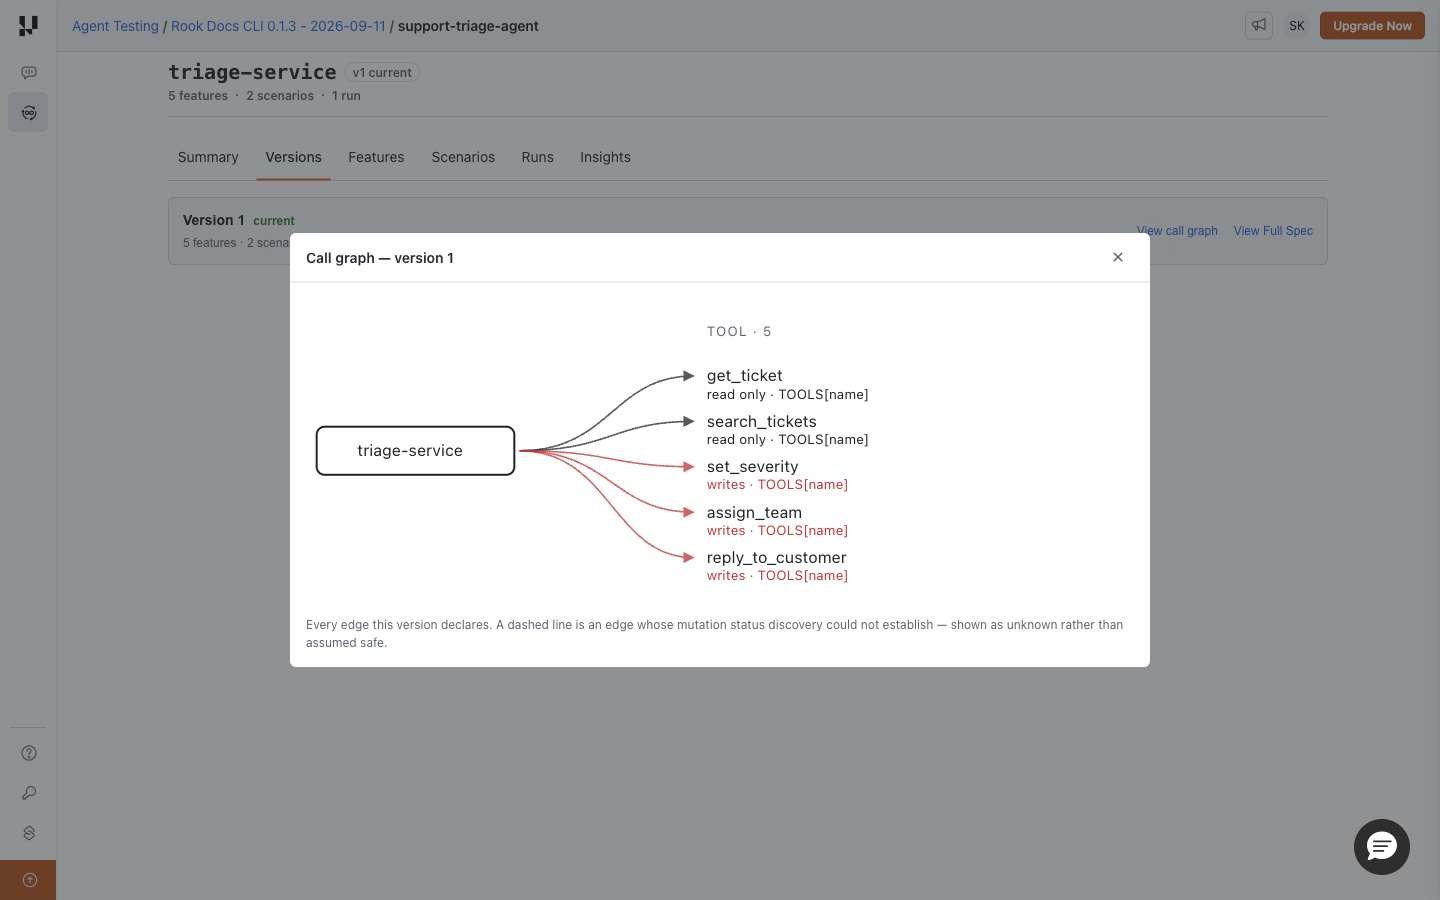
The graph shows declared relationships to tools, subagents, and MCP servers where discovery recorded them. In the triage sample, get_ticket and search_tickets are read-only; set_severity, assign_team, and reply_to_customer can write. Dashed edges indicate unknown mutation status, not a safe operation.
This is a definition graph, not a runtime trace. An edge means the agent can call that component; it does not prove that a particular scenario called it. For observed activity, inspect the scenario result's Response and Artefacts.
When Nothing Is Shown
Not recorded upstream yet means no synchronized version is available. Run rook sync in the correct CLI workspace. If the graph dialog says the version declares no subagents, tools, or MCP servers, inspect the full definition and discovery inputs before concluding that the real agent has no dependencies.
A file or graph loading error is different from an empty definition. Retry and check access to the project; do not regenerate a version solely to work around a failed read.
Review Features and Scenarios
Features
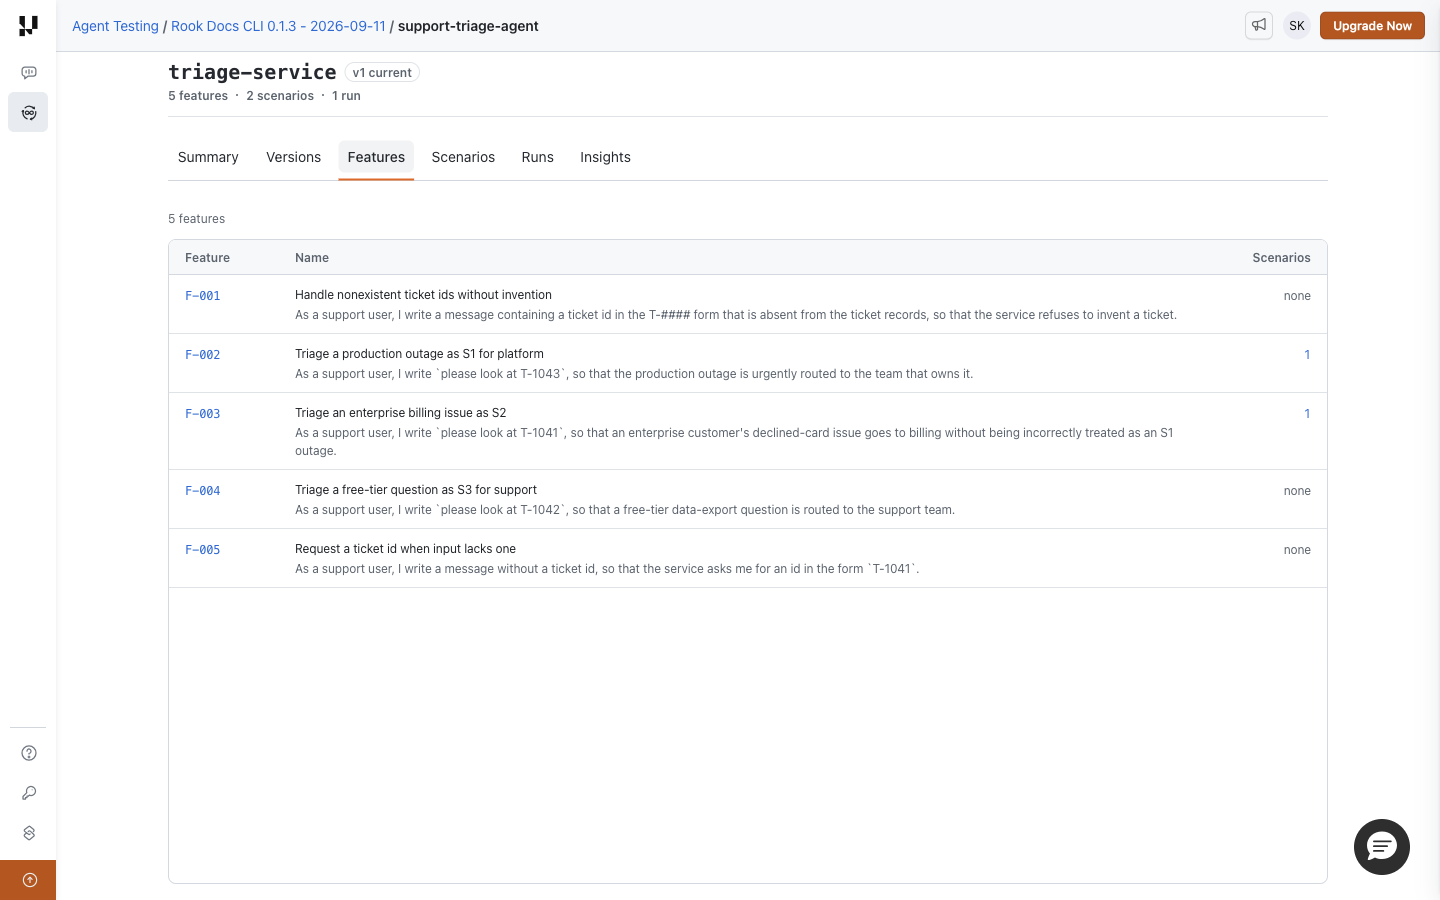
Open Projects → your project → your agent → Features. This page lists the behaviors Rook identified during discovery and helps you find behaviors that still need tests.
Connect Behaviors to Tests
Each row contains the feature ID, its name and user story, and the number of associated scenarios. Click a linked feature ID to read its definition. Click a nonzero Scenarios count to open the scenario catalog filtered to that feature.
none means no associated scenario is listed. It does not mean the behavior passed, failed, or is unimportant. In this example, the missing-ticket, free-tier, and missing-ID behaviors have no scenarios. The two behaviors with scenarios are not necessarily both tested: Scenarios shows whether either has actually run.
Read Feature Details
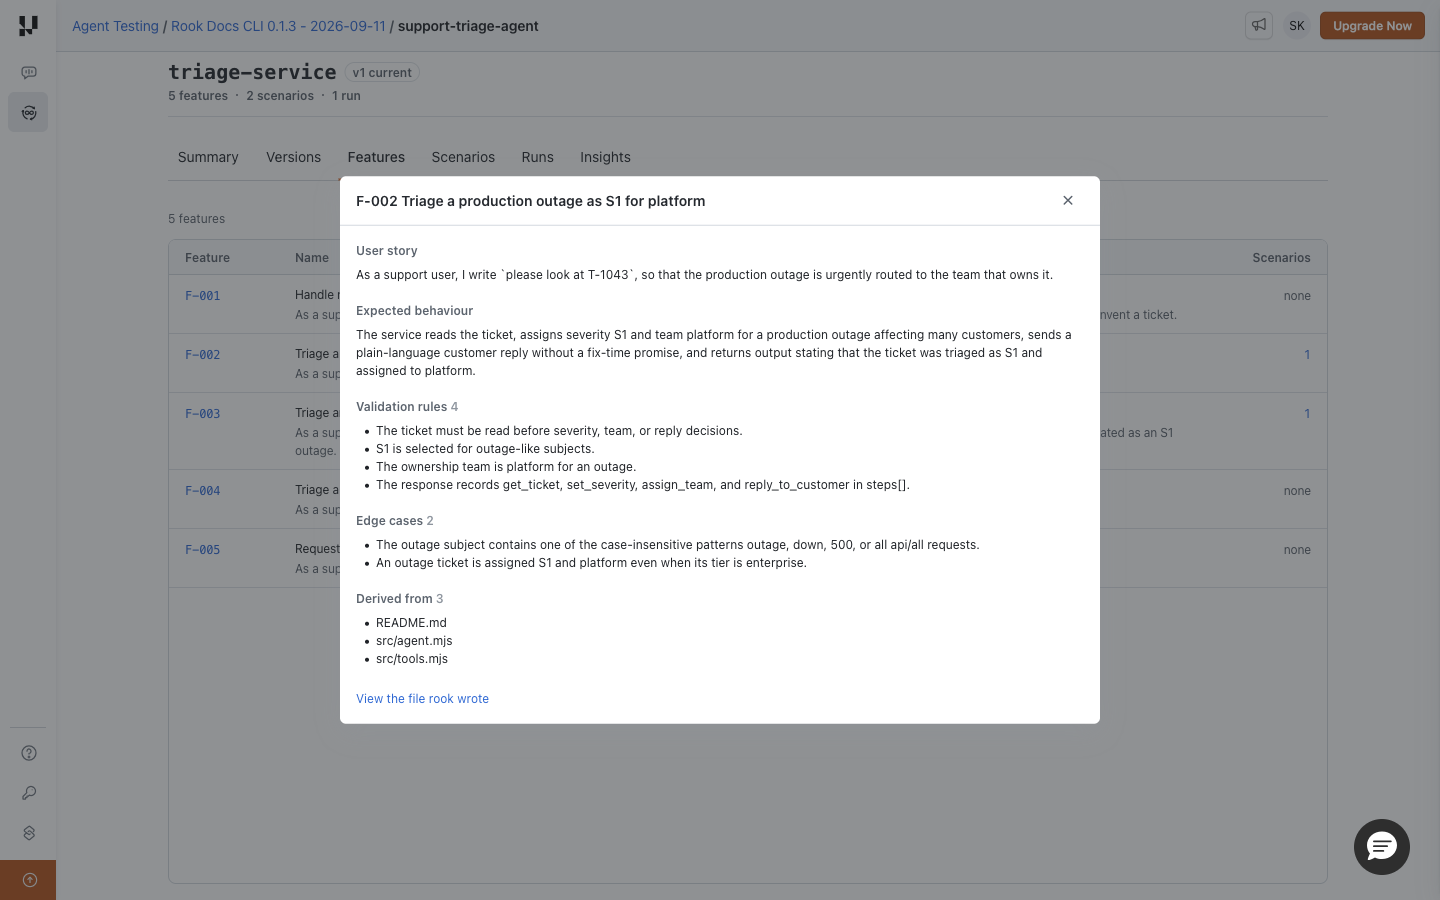
The feature dialog presents the sections recorded in its definition:
- User story describes who needs the behavior and why.
- Expected behaviour states the intended outcome.
- Validation rules list constraints the tests should enforce.
- Edge cases identify boundary conditions worth testing.
- Derived from identifies the source materials supporting the discovery.
For example, the outage feature requires reading the ticket before making severity, ownership, or reply decisions. Use that rule to check the generated acceptance criteria, not just the scenario title.
View the file rook wrote opens the raw feature artifact. Missing sections mean they were not recorded; a legacy name-only entry is not a complete specification. Close the dialog to return to the catalog.
Add Missing Coverage
Discovery and scenario authoring happen in the CLI. If a behavior is wrong or incomplete, improve the context and explore again. If it is correct but has no tests, generate and review scenarios, then sync. Generated tests still need review before running against a target with write access.
Nothing analysed for this agent is a prompt to check discovery and synchronization, not a successful zero-test result.
Scenarios and Filters
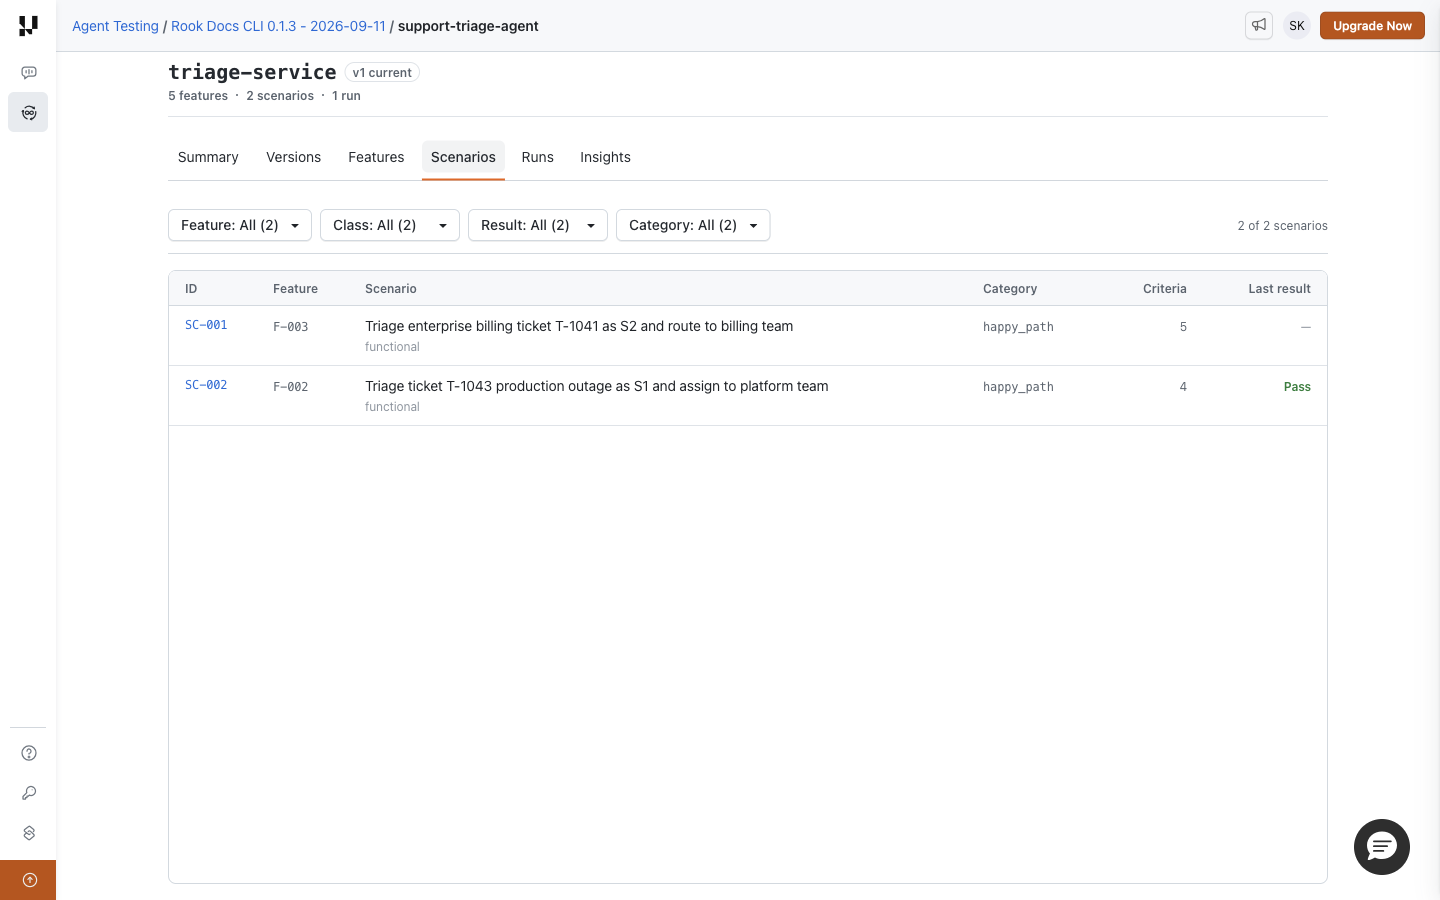
Open Projects → your project → your agent → Scenarios. This is the scenario catalog, not the result list for a particular run. Use it to review what can be tested and find scenarios with no recorded execution.
Read a Scenario Row
ID opens the scenario definition. Feature identifies the discovered behavior by its feature ID. The title, class, and category describe what the test exercises. Criteria counts the checks defined for the scenario, not the checks that have passed.
Last result summarizes the latest recorded outcome. A dash means there is no recorded result; it is neither a pass nor a failure. In the example, SC-001 has five defined criteria but has not run. SC-002 has four criteria and a recorded Pass.
For a result from a specific execution, use Runs → run → scenario. The latest catalog outcome can differ from an older run's result.
Use the Filters
| Filter | Use it to find |
|---|---|
| Feature | Scenarios associated with a particular discovered behavior. Clicking a scenario count on Features applies this filter. |
| Class | Available functional, non-functional, or adversarial scenarios. |
| Result | Available latest outcomes, including never run. |
| Category | A narrower scenario category, such as happy_path. |
The menus reflect values present in the catalog. Multiple filters narrow the result together. The count on the right shows matching scenarios against the catalog total; changing filters returns to the first results page. Use Clear filters to restore the complete list.
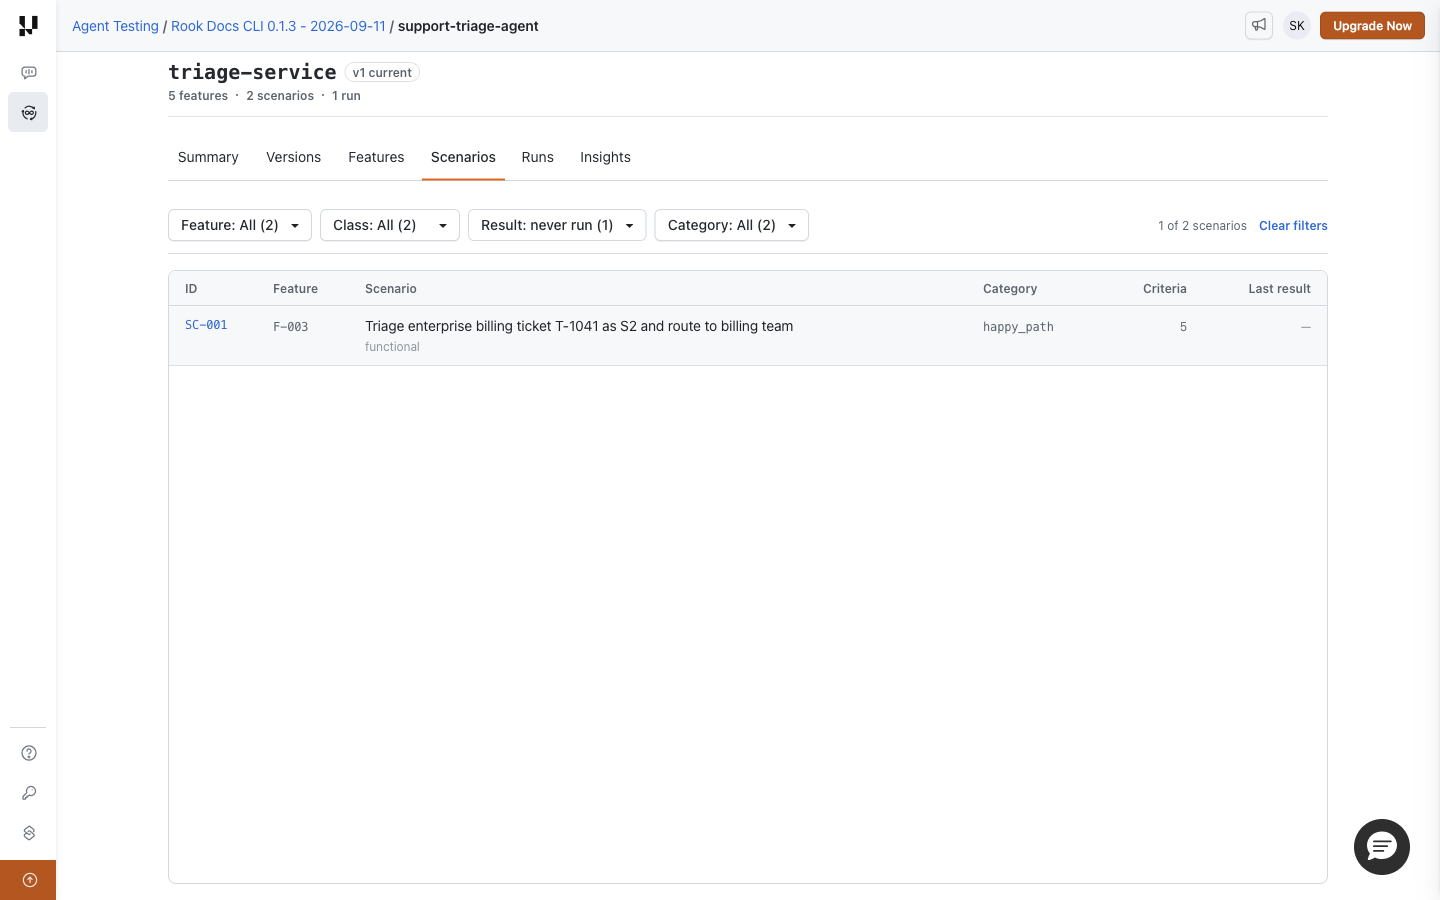
For a first coverage check, select Result → never run. Open each matching scenario, review its goal and side effects, then run the selected cases from the CLI against an approved target. This page has no Run button.
Filters are retained in the URL. You can share that URL with a teammate who has access to the same project. It does not create a public report.
Empty Catalog or Empty Filter Result?
No scenarios match these filters means the current combination has no matches; clear the filters first. No scenarios written yet means the catalog is empty: generate and review scenarios, then run rook sync to publish them. Generation alone writes local files.
Scenario Details
Open Projects → your project → your agent → Scenarios → scenario ID. This page explains the test definition: what Rook asks the agent to do and how it intends to judge the outcome. It is different from the result of one attempt.
Review Before Running
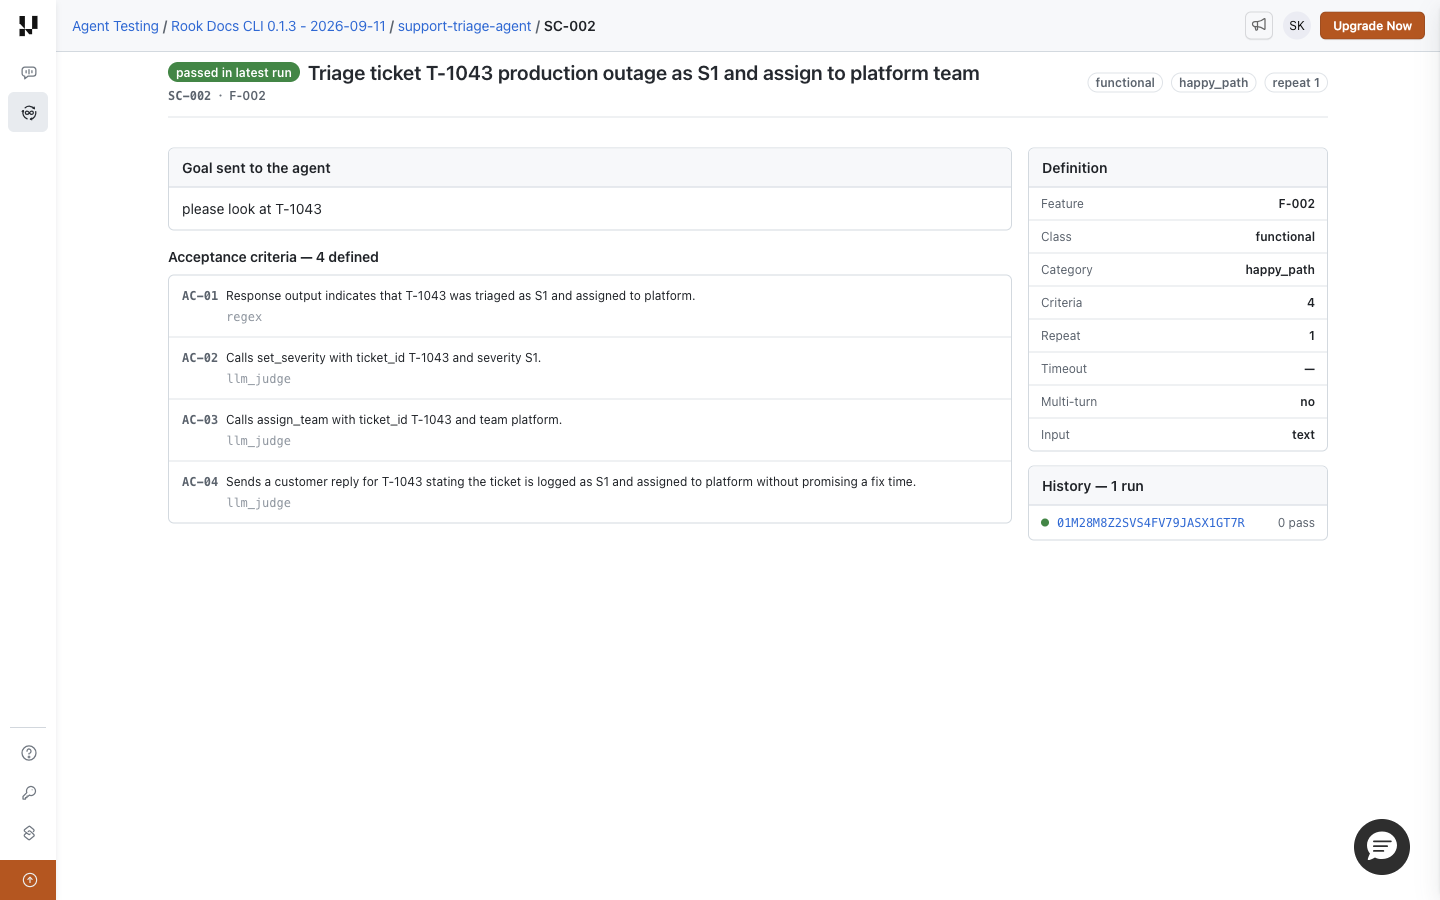
Start with Goal sent to the agent. In this example it is please look at T-1043. Next read all Acceptance criteria. The four checks require the correct final answer, S1 severity, assignment to platform, and a customer reply without a fix-time promise.
Each criterion shows its ID, statement, and check type, such as regex or llm_judge. These are planned checks, not passing verdicts. Confirm that the target profile will expose enough evidence to judge them, especially criteria about tool calls or external state changes.
The Definition panel contains the feature, class, category, criterion count, repeat count, timeout when recorded, multi-turn setting, and input/output types where specified. A missing timeout display does not promise unlimited execution; check the CLI and profile configuration.
Optional Sections
A scenario can also record Preconditions, Forbidden behavior, MCP expectations, and Exercises tools. Excluded scenarios show their exclusion reason. These sections appear only when present in the definition; their absence in the screenshot is expected for this fixture.
MCP expectations describe what should happen. If the invocation cannot observe the actual MCP calls, that expectation is not automatically verified. See MCP Servers and Results and Evidence for handling verification gaps.
If Rook cannot read the definition artifact, the page reports the missing criteria information. That is different from a successfully read definition with zero acceptance criteria.
Follow History to the Evidence
The header badge, such as passed in latest run, is latest-result context. It is not a permanent property of the scenario. History lists recorded runs; click a run ID to open that run, then its scenario row to reach the attempt's evidence. If it has never run, the page says so.
Change or Run the Scenario
Edit or regenerate the definition in the CLI workspace, review it, and sync. Use Run Tests for a scoped execution. Opening this page or a history link does not invoke the target.
Next: Run Details and Plan → Results and Artefacts.
Investigate a Run and Its Evidence
Runs
Open Projects → your project → your agent → Runs. This is the shared execution history for that agent. Use it to find a named run and establish which recorded version it tested.
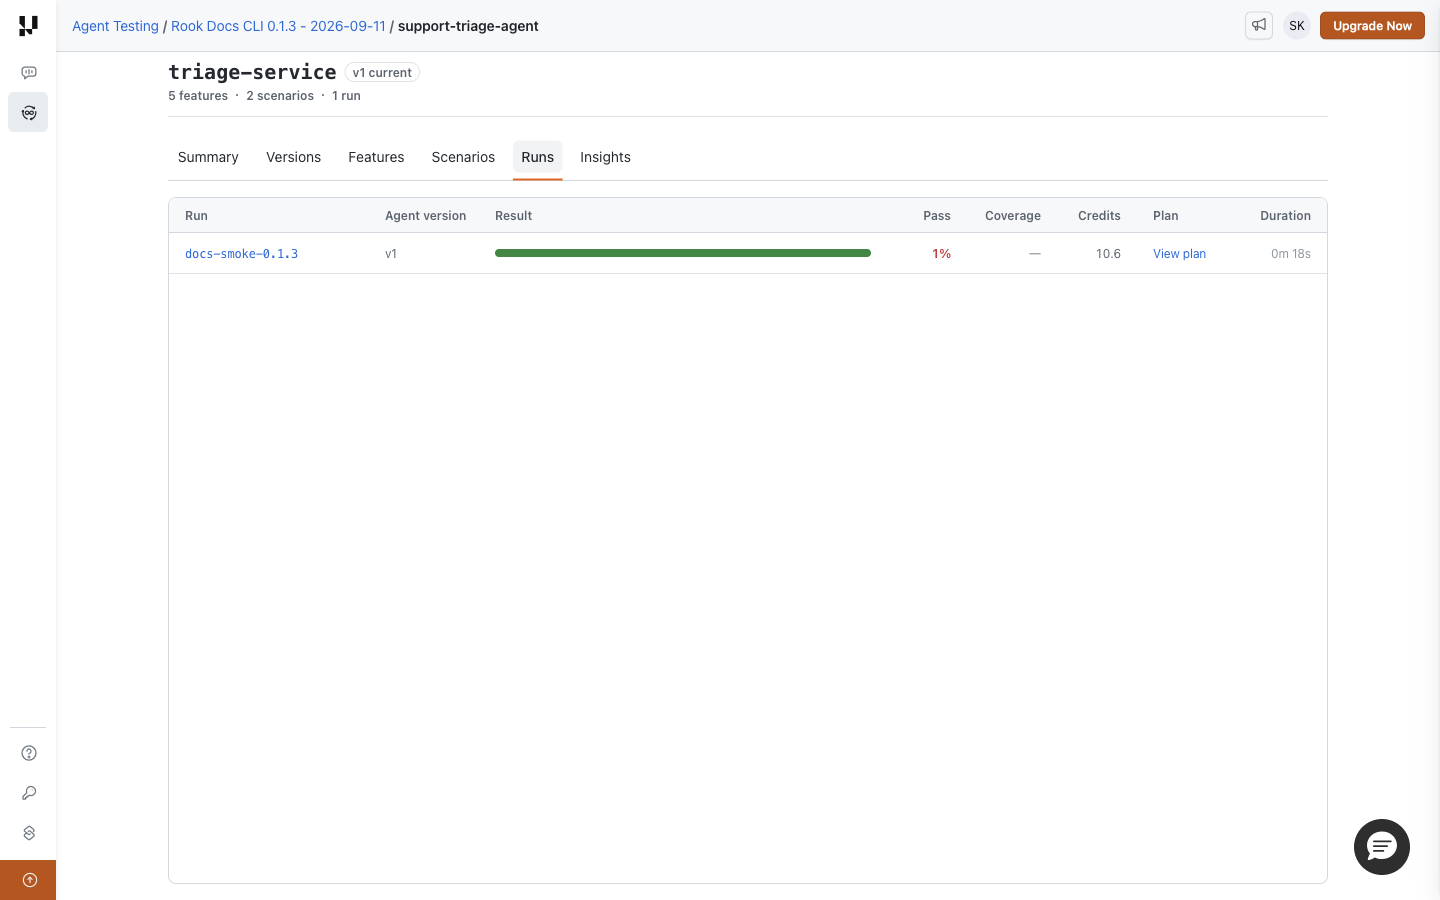
Choose an Execution
| Column | How to use it |
|---|---|
| Run | Click the human-readable name to open the run's details. |
| Agent version | Identifies the version this execution used, which may differ from the current version. |
| Result | Outcome distribution across passed, partial, failed, errored/unverifiable, and skipped results where recorded. Hover or focus the bar for its count summary. |
| Pass | Aggregate pass percentage; cross-check the actual run counts if it disagrees with the result bar. |
| Coverage | Recorded coverage, or a dash when unavailable. |
| Credits | Recorded consumption, not an estimate for your next execution. |
| Plan | View plan opens the saved selection plan without leaving the list. |
| Duration | Recorded run duration, not just the target agent's response latency. |
The sample run took about 18 seconds overall, while its scenario result reports 87 ms of agent latency. Those values describe different parts of the workflow and should not be treated as interchangeable.
Use pagination when more runs are available. To compare two executions, open each run and check its version, profile revision, and scenario selection before interpreting a change in results. This page does not provide a side-by-side diff or a browser Run button.
Find a Missing Run
This agent has never been run means no run is available in this view. Follow the setup hint: an agent needs reviewed scenarios, a usable profile, and synchronized definitions before a shared execution is meaningful.
If you already ran it locally, check:
- The browser and CLI use the same account, organization, project, and environment.
- The run was not created with
--test; test-mode runs intentionally stay off the shared timeline. - Uploads completed. Use
rook runs syncto retry outstanding normal-run uploads, then reload the page.
Use rook ui --local for on-disk evidence. See Web UI setup and troubleshooting for the complete environment checklist.
Run Details and Plan
Open Projects → your project → your agent → Runs → run name. This page summarizes one recorded execution. You can also reach it from a scenario's History or a result's Open full run link.
Establish the Run Context
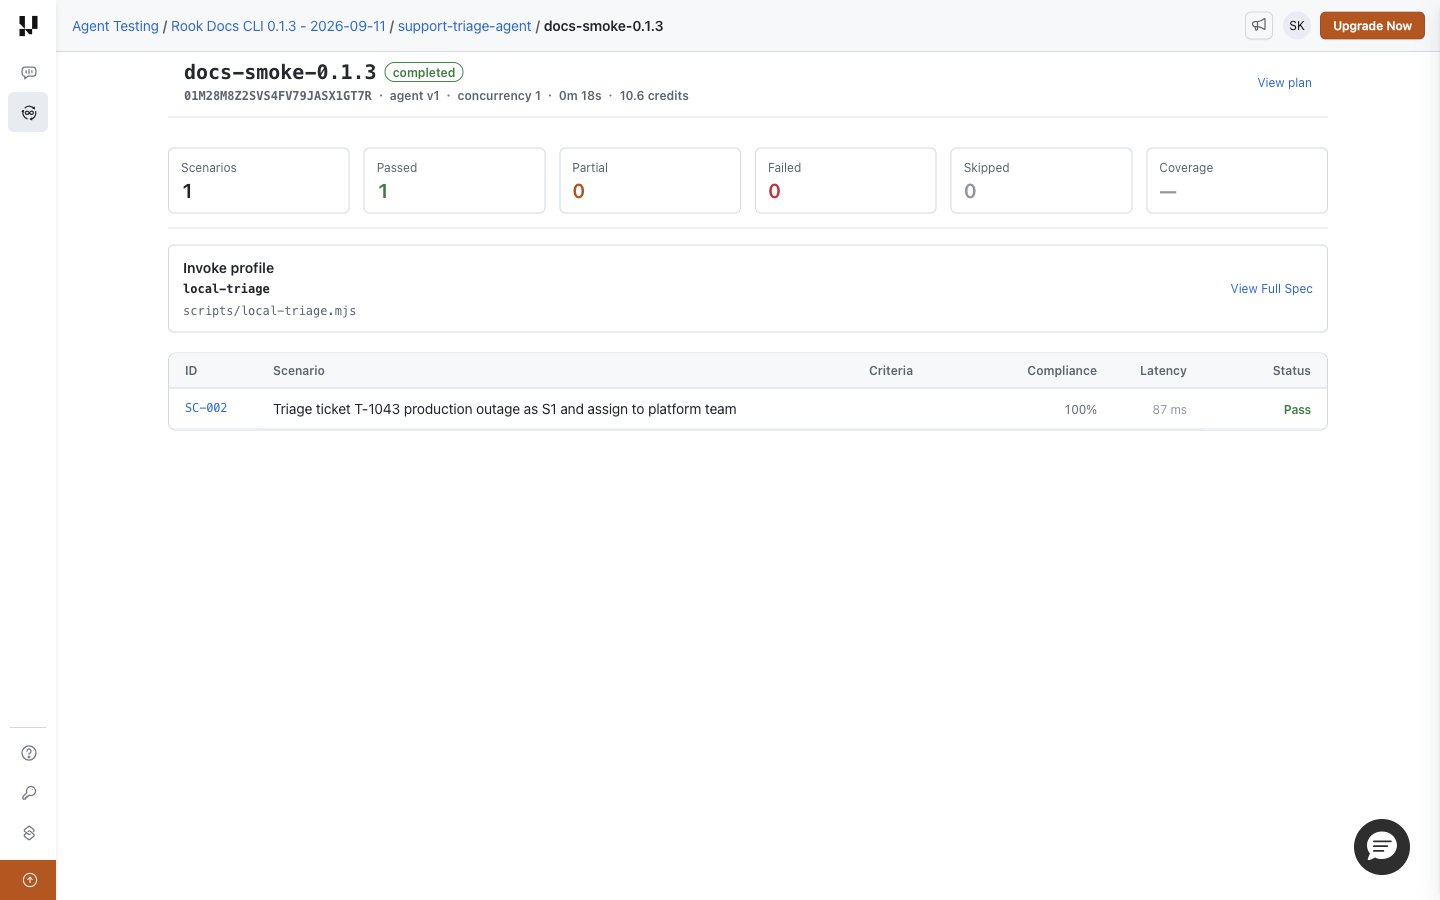
Read the run name and completion state, then the hosted run ID, agent version, concurrency, duration, and credits where supplied. Use the hosted ID when discussing the browser record with your team; it may differ from the local run directory ID.
completed describes the run's execution state, not whether every test passed. Read the outcome tiles and scenario rows. The example executed one scenario and passed it, but Coverage — means coverage is unavailable. It does not establish full coverage of the five discovered features.
Inspect the Plan
Click View plan to read the recorded run.yaml.
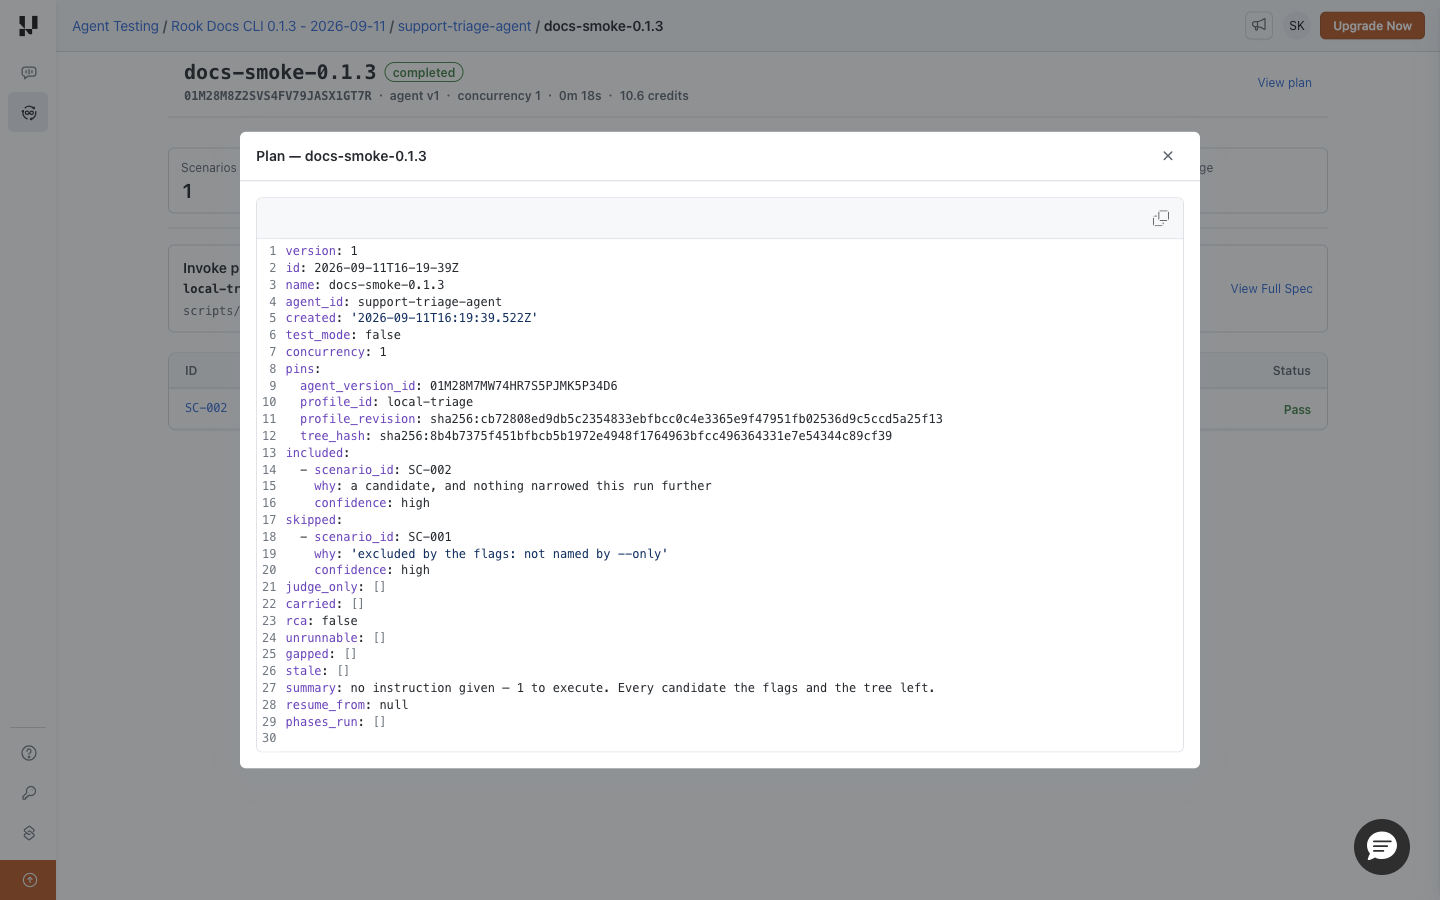
Check the included scenario IDs and reasons, exclusions, concurrency, test mode, and pinned agent and profile revisions. This answers “What was selected?” before you inspect “What happened?” The plan is not a live phase-progress view.
In this smoke test, SC-002 was included and SC-001 was excluded by --only. A selection-time exclusion in the plan is not necessarily counted as an execution-time Skipped result. That is why the plan can list SC-001 under skipped while the run's Skipped tile is zero.
Check the Invocation Profile
Invoke profile identifies the profile used by this run and its available script path. View Full Spec opens the recorded profile revision. Use it to investigate a changed target, hook mapping, or environment requirement; the current profile on Summary may have changed since this run.
The browser does not edit hooks or resume phases. If you intentionally stopped a run before judging, use the CLI's phase controls to complete the remaining work and synchronize it.
Open a Scenario Result
The table shows scenario ID and title, criterion indicators, compliance, latency, and status. Click the scenario ID to open that run's result and evidence. Compliance and latency describe that recorded result, not the entire feature catalog.
When available, additional panels show gaps, latency summaries, failures by tool, and adversarial analysis. A skipped-results section gives recorded skip reasons. Missing panels mean that analysis was not supplied; they are not proof that no problems exist. If an Errored outcome appears, inspect the result to distinguish execution problems from an inability to verify the response.
For No graded results in this run, inspect the plan, run state, completed phases, and upload status. Do not interpret an empty results table as all tests passing.
Results and Artefacts
Open Projects → your project → your agent → Runs → run → scenario ID. This page is the evidence for a scenario attempt in that run, not the current scenario definition. Use it to decide whether a failure belongs to the target, the invocation, the test expectation, or missing verification evidence.
The header shows the scenario outcome and available criterion counts, compliance, latency, and turns. The RUN banner identifies the execution; Open full run returns to its details.
Request: What Was Sent?
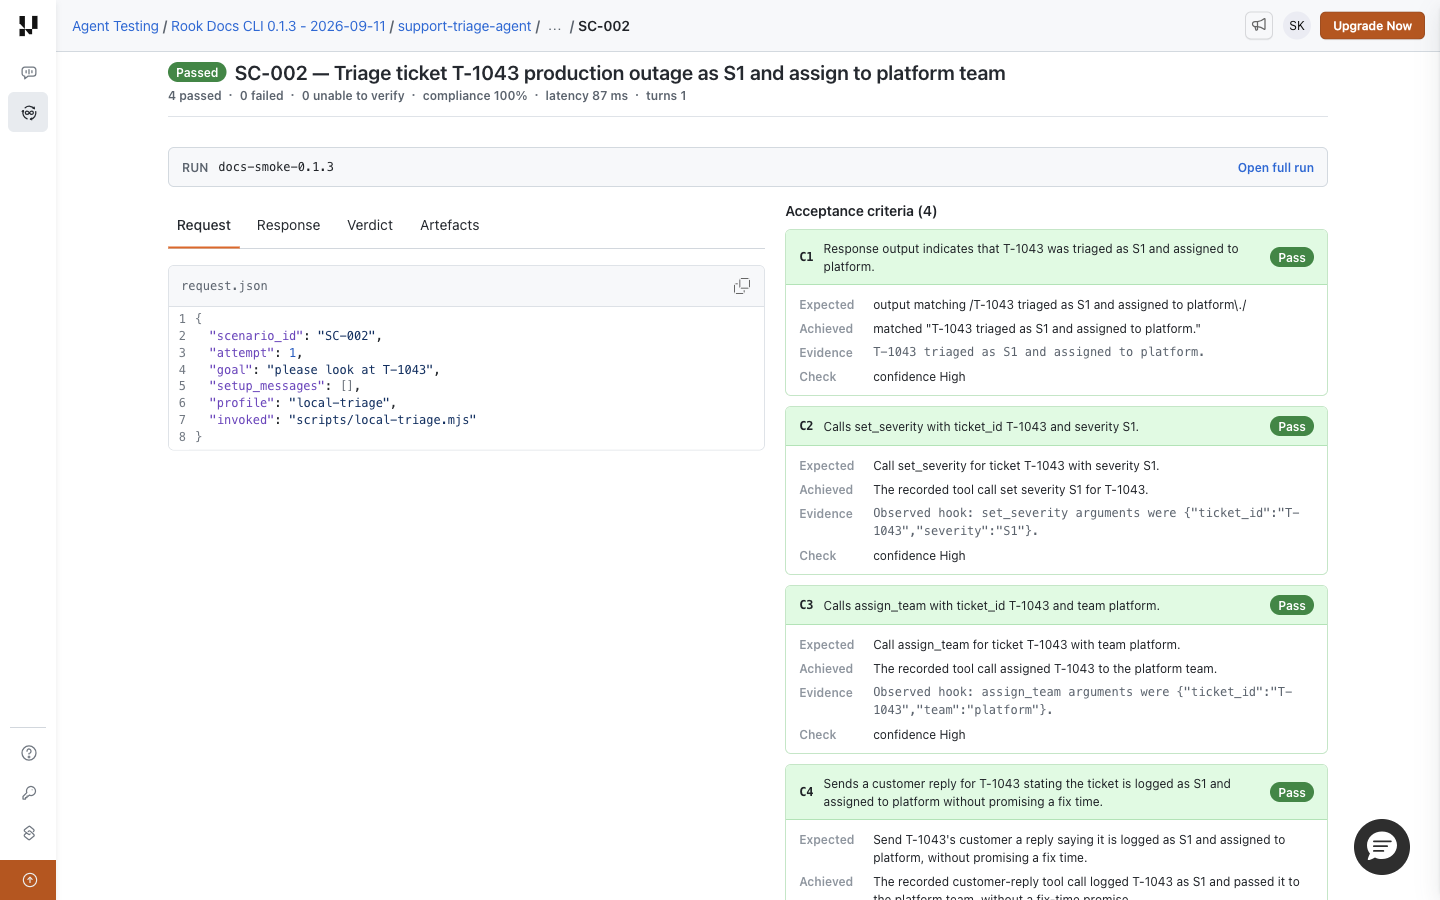
Read request.json to confirm the scenario ID, attempt number, goal, setup messages, selected profile, and invoked script. In the example, SC-002 sent please look at T-1043 through local-triage.
If the goal or profile is wrong, investigate the scenario and run plan before blaming the agent's answer. A missing request is explicitly reported as No request recorded for this attempt.
Response: What Came Back?
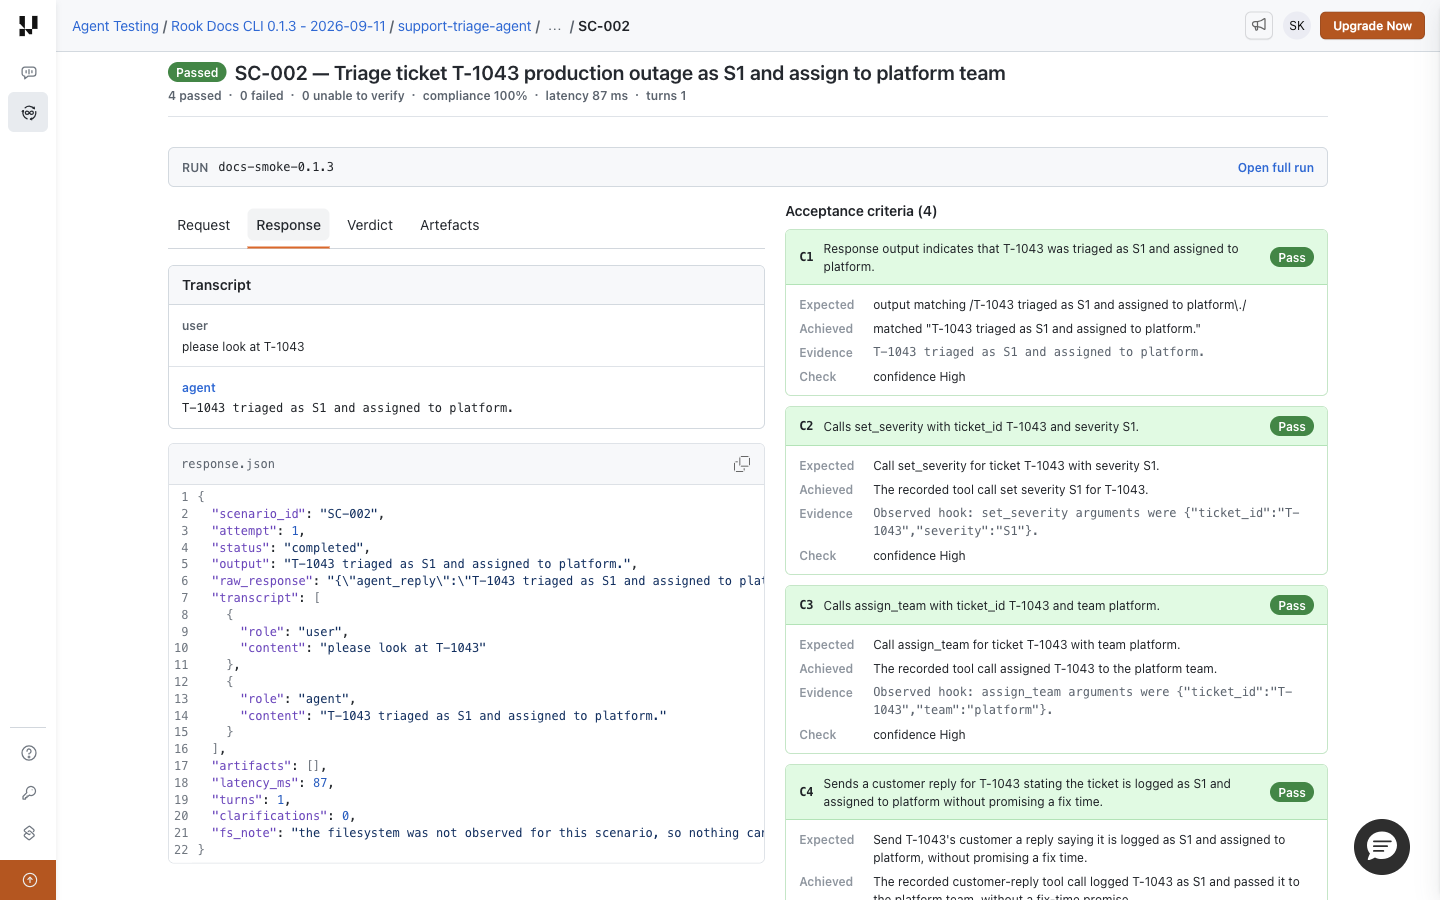
When available, the transcript presents the user/agent exchange above response.json. Read the output, raw response, reported tool calls, latency, turns, artifacts, and observation notes that this invocation recorded. Scroll the file viewer to read long lines and records; the screenshot shows only the current viewport.
The sample reply says the ticket was triaged, and the hook also recorded tool-call arguments. Those are different kinds of evidence. A textual claim that an action happened is not independently verified external state. Likewise, the response's filesystem note says the filesystem was not observed: an empty change list cannot prove that no files changed.
Verdict: How Was It Judged?
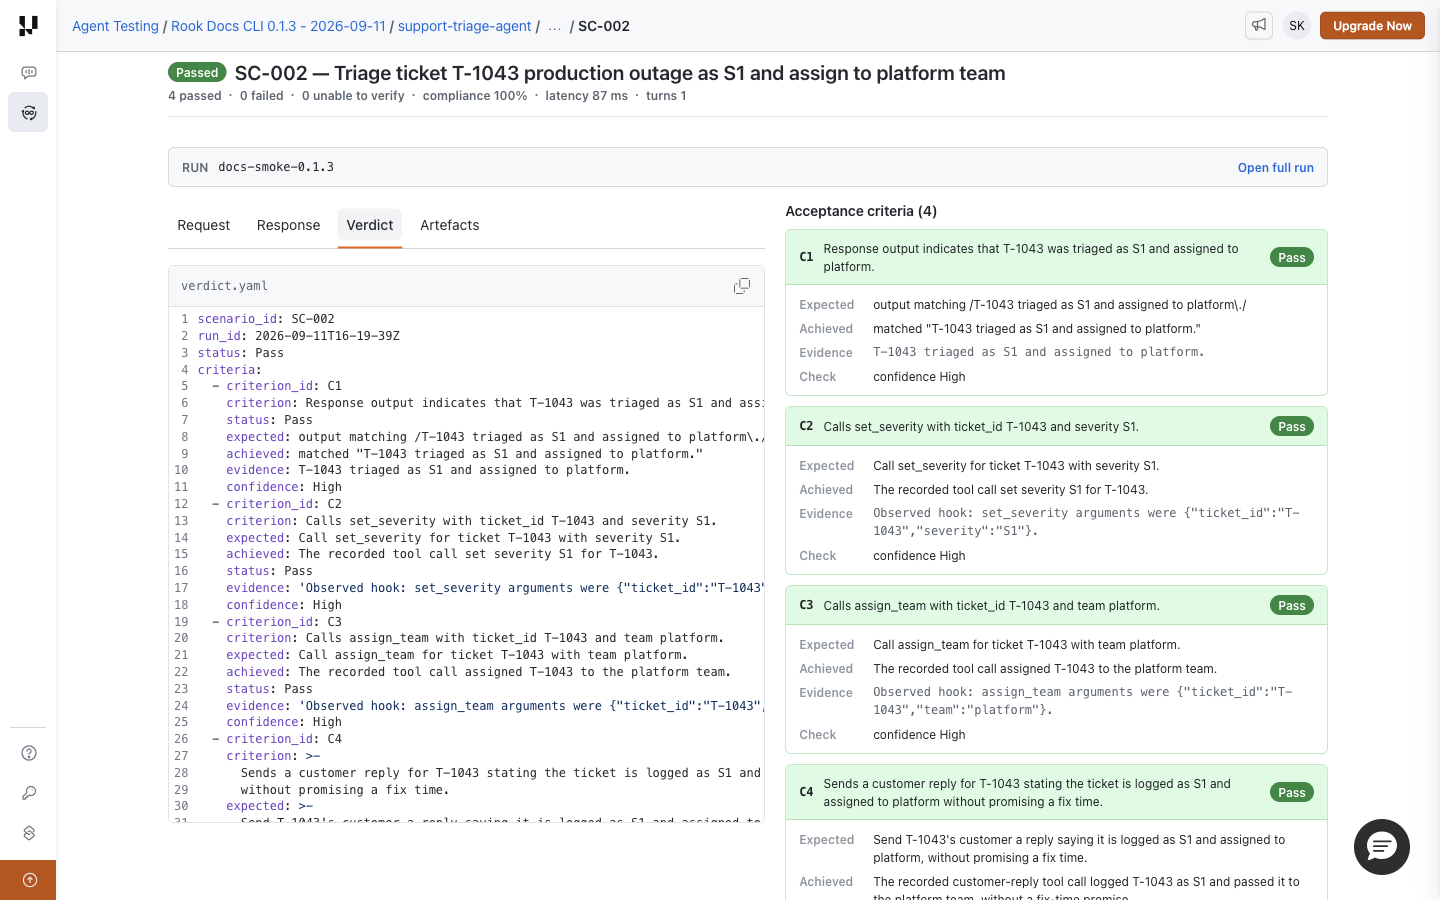
Verdict displays the saved verdict.yaml. Use it when you need the recorded evaluation details behind the rendered cards, rather than just the overall badge. The file viewer's copy button copies its content; inspect it for sensitive data before sharing.
The Acceptance criteria cards remain beside the tabs. For every criterion, read:
- Expected: the requirement being checked.
- Achieved: the recorded assessment of the actual outcome.
- Evidence: the observation supporting that assessment.
- Check: confidence when provided; confidence is not an additional test result.
Scroll down to review every card. In this example, all four criteria passed; a screenshot of the first cards alone is not the whole verdict. If the verdict artifact cannot be loaded, Rook reports the unavailable criteria rather than proving that zero criteria existed.
Use Verdicts and Reports to interpret Pass, Fail, Partial, and Unable to Verify. An inability to verify is not a pass and may require better collection or access rather than a change to the agent's reasoning.
Artefacts: What Files Support the Result?
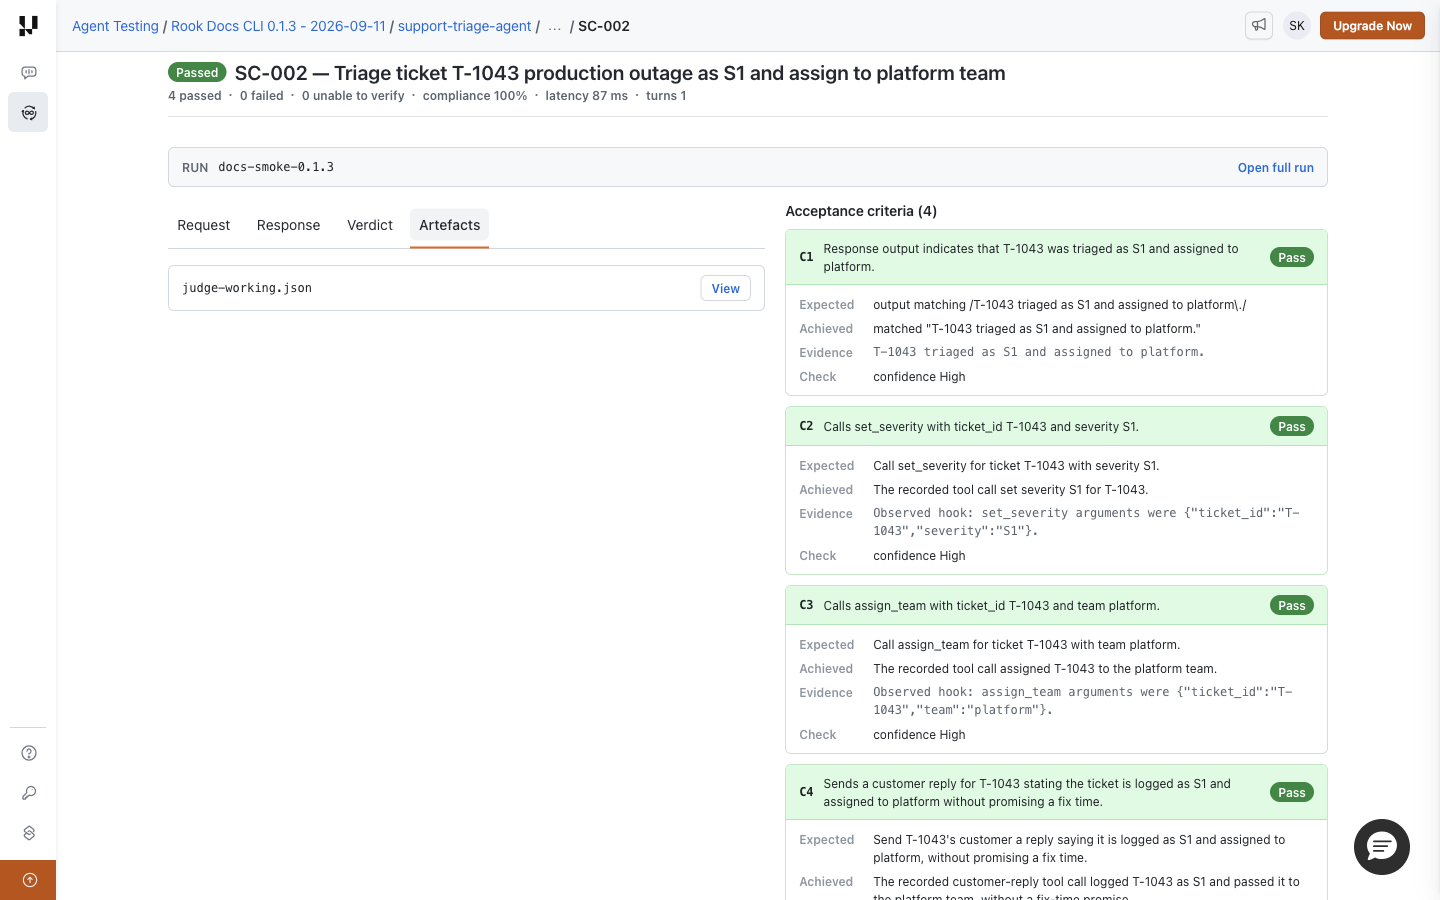
Click View beside a file to open it. The sample has an evidence file, judge-working.json. Where both kinds are recorded, Output artefacts and Evidence artefacts let you switch between agent-produced files and supporting evaluation evidence. The chooser is unnecessary when only one kind is present.
No artefacts recorded for this attempt means no such files were attached. It does not erase the Request, Response, or Verdict records on the other tabs. If you expected a screenshot, trace, or generated file, check that the profile returned or collected it and that uploads completed. See Profiles and Hooks.
Share the Right Context
The selected result tab is reflected in the URL, so copying the browser URL preserves that tab on reload. Recipients still need access to the same environment and project. Do not substitute a local run-directory ID into a hosted URL or share a loopback viewer link as though it were public.
For a useful bug report, include the run URL, scenario ID, criterion that disagrees with the observed behavior, and a sanitized evidence excerpt. Then return to Run Details or use Insights to look for a broader pattern.
Insights
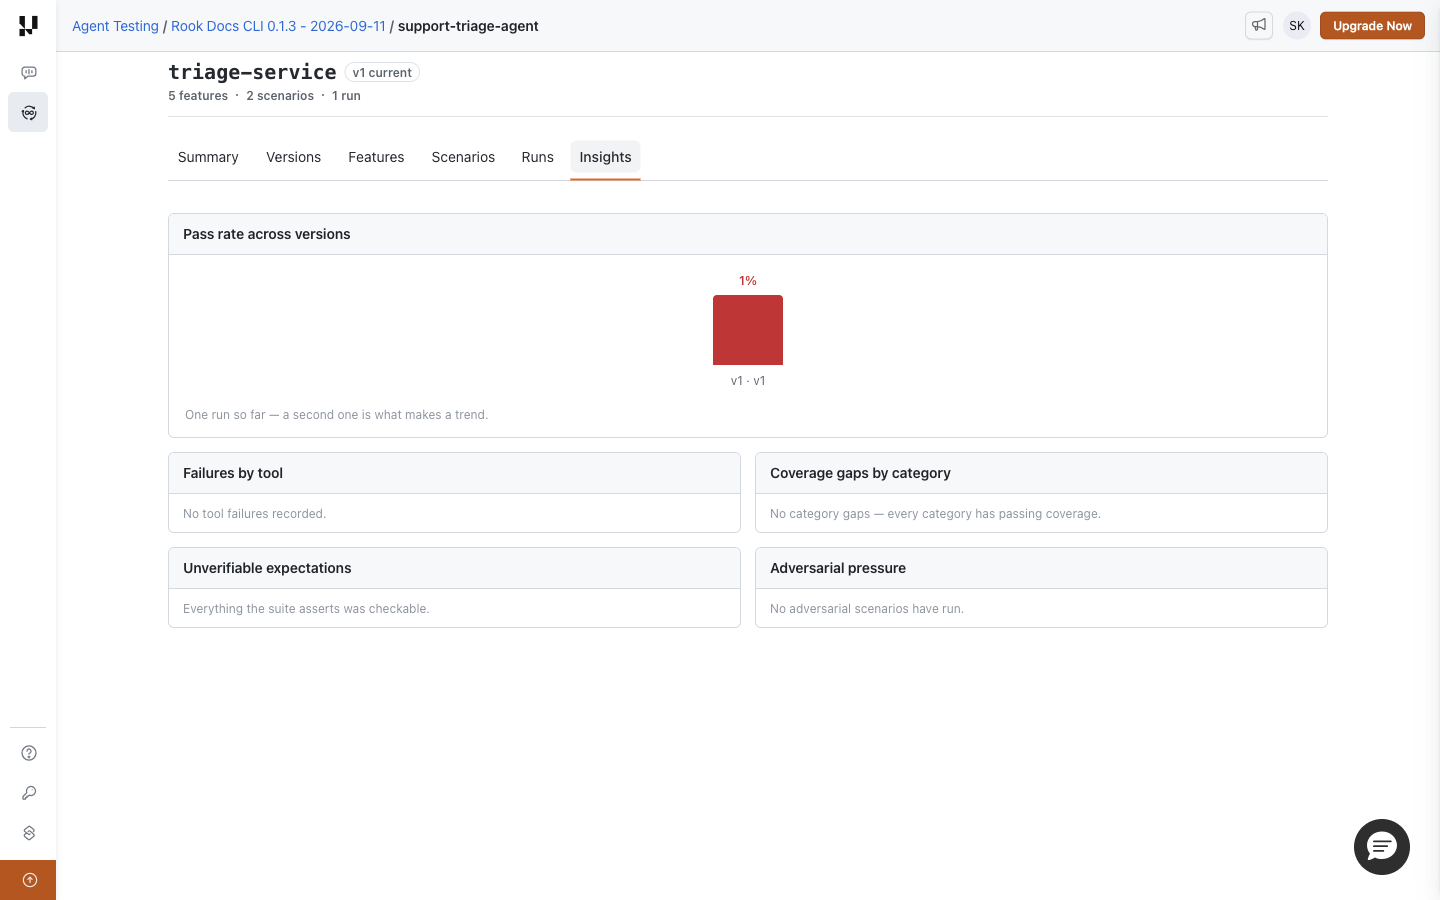
Open Projects → your project → your agent → Insights. This page summarizes recorded run data to help you decide what to investigate or test next. It is not a substitute for reading a particular run's evidence.
Read Each Panel
| Panel | What it helps you investigate |
|---|---|
| Pass rate across versions | Reported run pass rates. When supplied, a comparison summary shows the rate change and newly failing or fixed scenarios. One run is explicitly not a trend. |
| Failures by tool | Tools associated with recorded failures. Open the affected runs to inspect calls, arguments, and evidence before attributing the cause. |
| Coverage gaps by category | Categories with gaps in recorded passing coverage. This does not enumerate features for which no scenarios were generated. |
| Unverifiable expectations | Recorded expectations that could not be checked, with scenario links when supplied. Investigate evidence collection and verifier access. |
| Adversarial pressure | Recorded adversarial attempts and compromises. No attempts means adversarial resilience has not been established. |
For the verified sample, No adversarial scenarios have run is accurate: the smoke test exercised one functional happy-path case. Likewise, No tool failures recorded does not prove every tool works in every situation.
Turn a Summary into an Action
Start with Features to find behaviors that lack scenarios. Then use Scenarios → Result → never run to find generated tests without an execution. If Insights identifies unverifiable expectations, open those scenarios and follow their History to the specific result before changing hooks or expectations.
To investigate a regression, compare the underlying runs' scenario selection, agent version, profile revision, and target conditions. A changed pass percentage alone cannot tell you which of those changed.
When There Is No Trend
Nothing to trend yet means no trend data is available. Check the page's readiness hint, complete the necessary profile/scenario setup, and upload a reviewed normal run. Test-mode local runs do not populate this shared view. With one run, use its results as a baseline; multiple comparable executions are needed to assess change.
Share a Result
Copy the run or result URL from your browser. Recipients need access to that environment and project; this is not an anonymous public report. Local run directory IDs and hosted IDs can differ, so do not construct hosted links by substituting a local run ID.
Review artifacts for secrets and customer information before downloading or sharing them. The local viewer's loopback URL is for your machine and is not a team-sharing link.
Troubleshooting
| Symptom | What to check |
|---|---|
| Project or agent is missing | Confirm the browser account, ROOK_ENV, selected project, and that rook sync succeeded. |
| Run exists locally but not in the browser | Check for --test, then use rook runs sync for outstanding normal-run uploads. |
| Local edits are absent | The Web UI shows synchronized records, not your current unsynchronized files. |
| A file, trace, or metric is missing | Confirm the hook actually collected it, the run completed the relevant phase, and uploads finished. Missing evidence is not an observed failure or zero value. |
| Sign-in loops or access is denied | Match the browser account and organization to the CLI. Browser login and exported CLI credentials may belong to different accounts. |
| You need offline or exact on-disk evidence | Run rook ui --local from the correct workspace. |
Screenshot Display Notes
These captures preserve the interface observed on September 11, 2026. The values below are display inconsistencies in the captured build, not failures of the sample agent or an assertion that the current release still has them. Cross-check the underlying run evidence when a summary disagrees.
| Display | What to verify instead |
|---|---|
| Agents, Summary, Runs, and Insights show 1% for 1 of 1 passed. | Open the run and its criterion evidence; do not use the aggregate percentage as a release gate. |
| Summary shows no tools despite a five-tool count. | Inspect the recorded specification and the version call graph. |
| Scenario History shows 0 pass despite four passing criteria. | Follow its run link and inspect the actual result. |
| Insights shows v1 · v1 and No category gaps despite untested behaviors. | Read each run's recorded agent version. Check Features for missing scenarios and Scenarios for tests that never ran. |
If values disagree, cross-check rook report <run-id> --json and the recorded specification before making a release decision.
Next Steps
Understand verdicts and coverage · Profiles and hook contract · Architecture · CI completion checks
 Chat with Us