Starting a Performance Scan in Web Scanner
Overview
A performance scan measures how fast your pages load. For every URL in the scan, Web Scanner runs Google Lighthouse and reports the performance score, the Core Web Vitals and the Lighthouse findings that slow the page down.
Use a performance scan to:
- Check the load speed of many pages in one run, for example every page in a sitemap.
- Track the same pages on a schedule and spot pages that get slower after a release.
- Measure pages on a staging site, through a tunnel, a dedicated proxy or a geolocation.
Results are lab data: every scan uses the same fixed device, network and CPU settings, so two scans of the same page can be compared. Real visitors on other devices and networks will see different numbers.
Performance scans must be included in your organization's plan. If they are not, clicking Run Scan or Schedule scan shows the message "Your plan doesn't include Web Scanner performance scans. Please contact support@lambdatest.com to add it to your plan." Contact support or your account manager to enable them.
Create a Performance Scan
Go to the Web Scanner dashboard, open the Performance tab and click Schedule scan. The wizard has four steps.
Step 1: Scan Overview
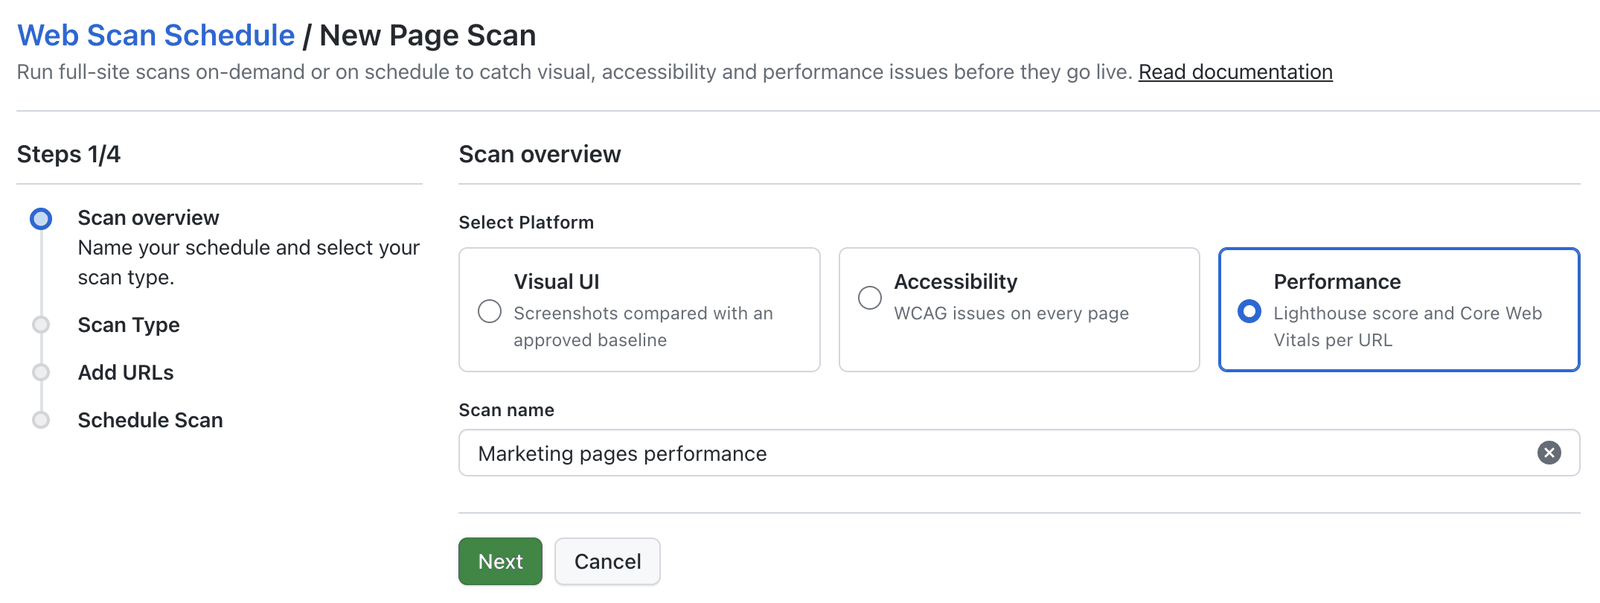
- Under Select Platform, choose Performance.
- Enter a Scan name. The name must be unique among your organization's performance scans.
- Click Next.
Step 2: Scan Type
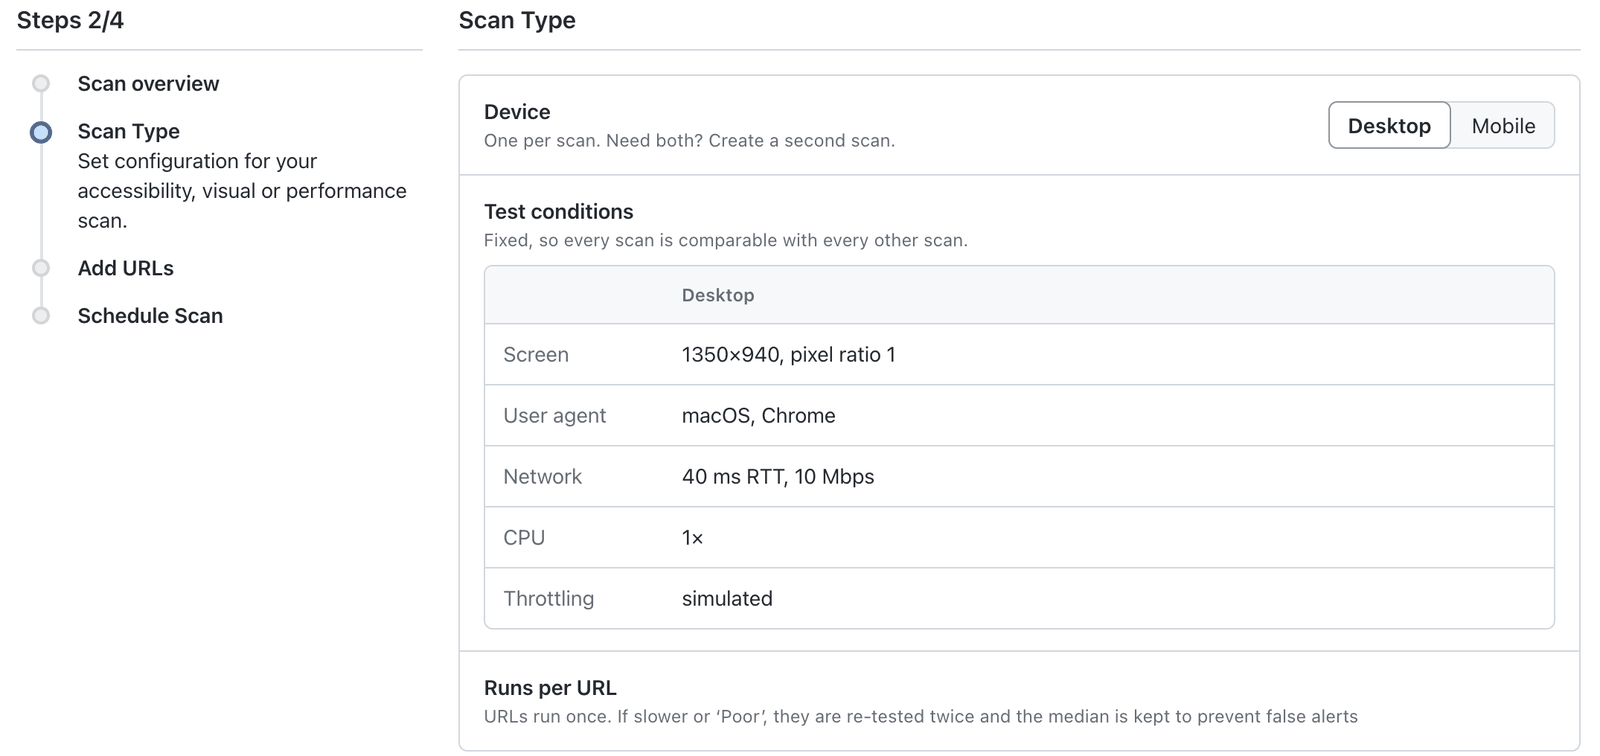
Choose the Device the pages are measured on: Desktop or Mobile. A scan uses one device. To measure the same pages on both, create a second scan.
The Test conditions table shows the fixed settings for the selected device. You cannot change them, which is what keeps every scan comparable with every other scan.
| Setting | Desktop | Mobile |
|---|---|---|
| Screen | 1350×940, pixel ratio 1 | 412×823, pixel ratio 1.75, mobile viewport and touch |
| User agent | macOS, Chrome | Android 11, Moto G Power (2022), Chrome Mobile |
| Network | 40 ms RTT, 10 Mbps | Slow 4G: 150 ms RTT, about 1.6 Mbps down |
| CPU | 1× | 4× slower than the machine |
| Throttling | Simulated | Simulated |
Runs per URL: each URL runs once. When a URL is rated Poor, it is tested two more times and the median run is kept, so a single slow load does not raise a false alert. Every run starts with a cold cache.
Step 3: Add URLs
Add the pages to measure in one of three ways:
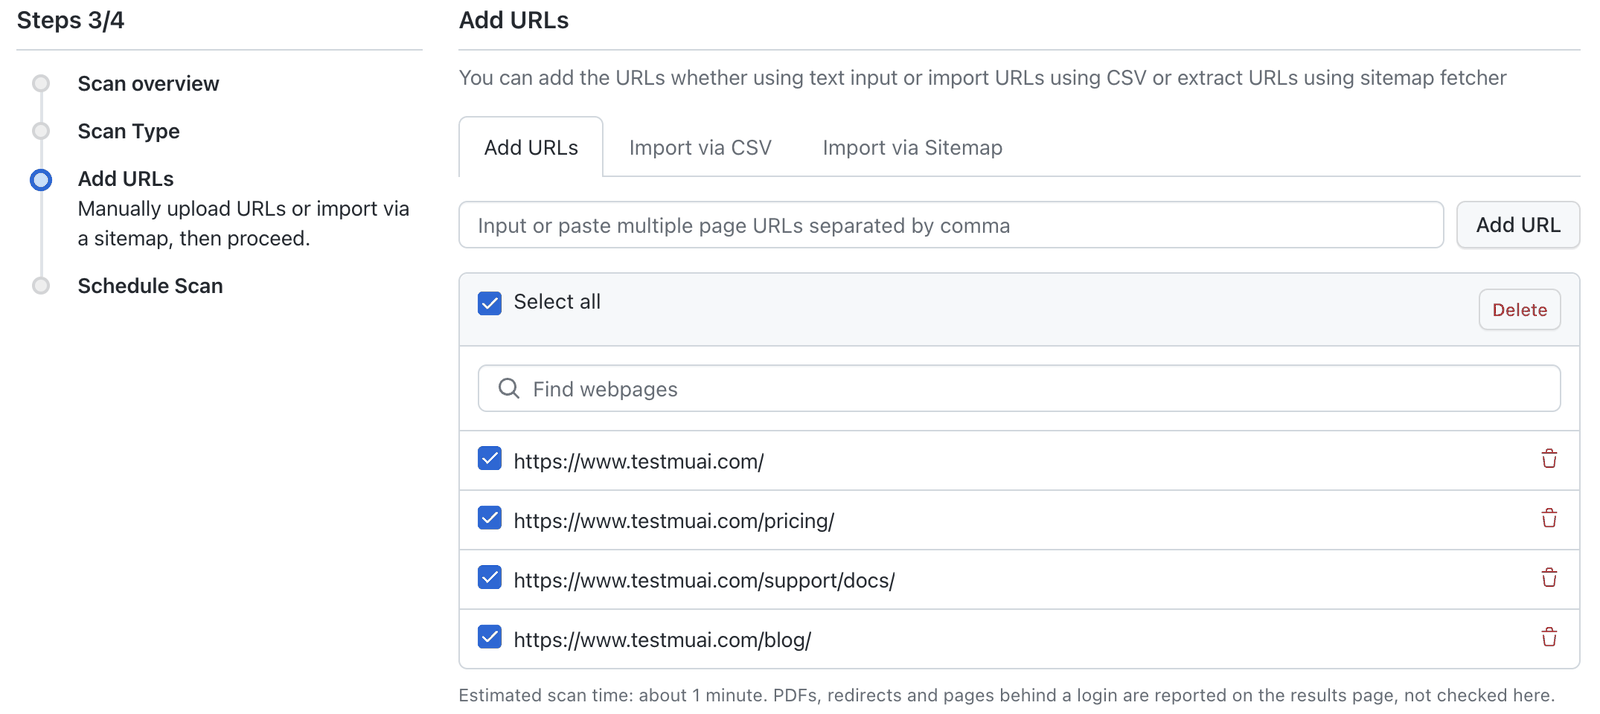
- Add URLs: paste one or more URLs separated by commas and click Add URL.
- Import via CSV: upload a CSV file of URLs.
- Import via Sitemap: fetch a sitemap and pick URLs from it.
See Adding URLs for the CSV and sitemap options. A scan takes up to 20,000 URLs. Switching between the three tabs removes the URLs you have already added, and a dialog asks you to confirm first.
Below the list, the wizard shows an estimated scan time. PDFs, redirects and pages behind a login are not checked at this step. They are reported on the results page.
Advanced Configurations
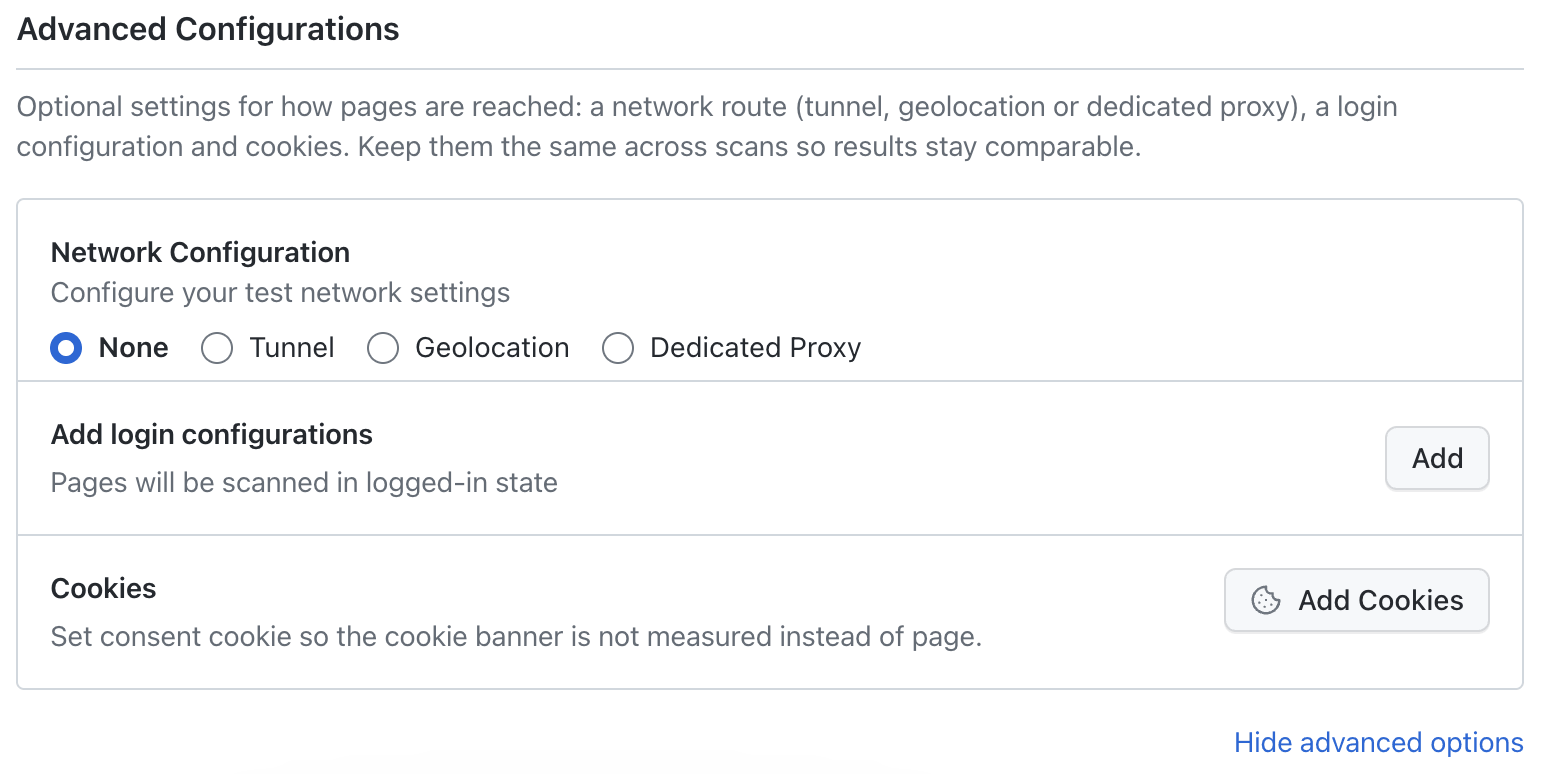
Expand Advanced Configurations to control how the pages are reached:
- Network Configuration: None, Tunnel, Geolocation or Dedicated Proxy. Use a tunnel or a dedicated proxy to measure staging or internal sites.
- Add login configurations: measure pages in a logged-in state.
- Cookies: set a consent cookie, so the scan measures the page and not the cookie banner.
Keep these settings the same across scans, so the results stay comparable. See Advanced Features for how to set each option.
Step 4: Schedule Scan
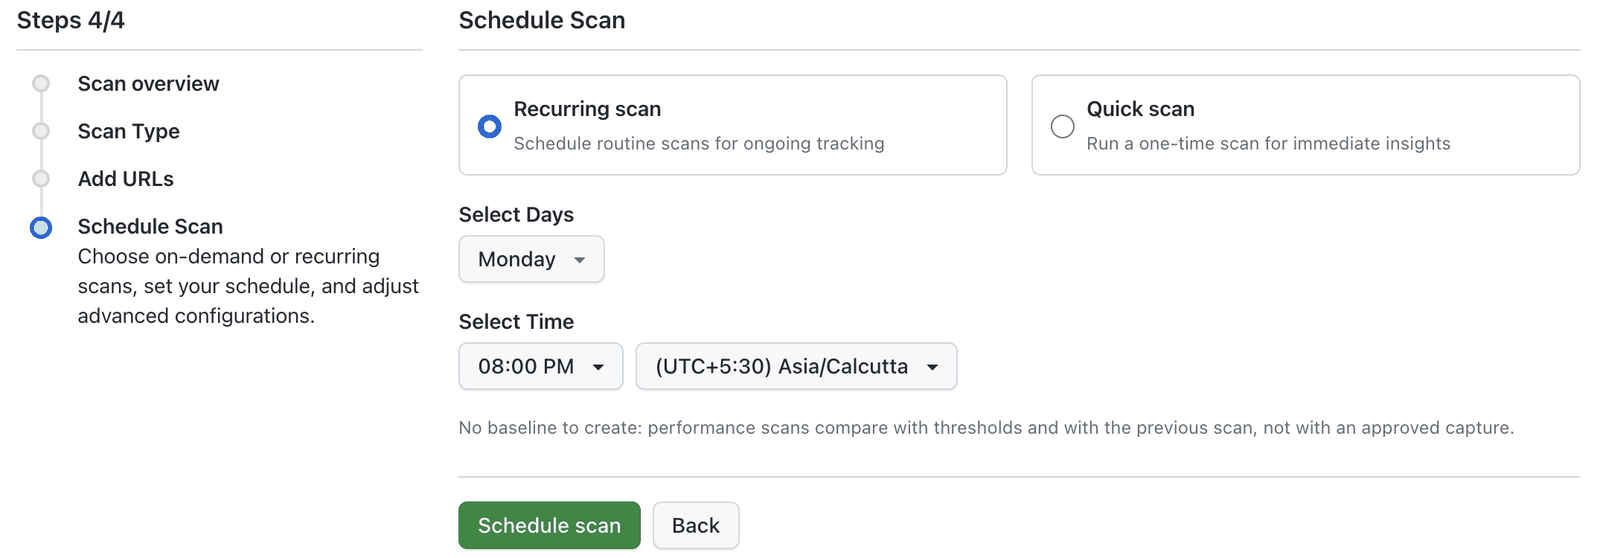
Choose when the scan runs:
- Recurring scan: pick the days, the time and the time zone, then click Schedule scan.
- Quick scan: run the scan once, now. Click Run Scan.
A performance scan has no baseline to approve. Each scan is rated against fixed thresholds and can be compared with the previous scan. See Scheduling Options for more on recurring schedules.
Manage Performance Scans
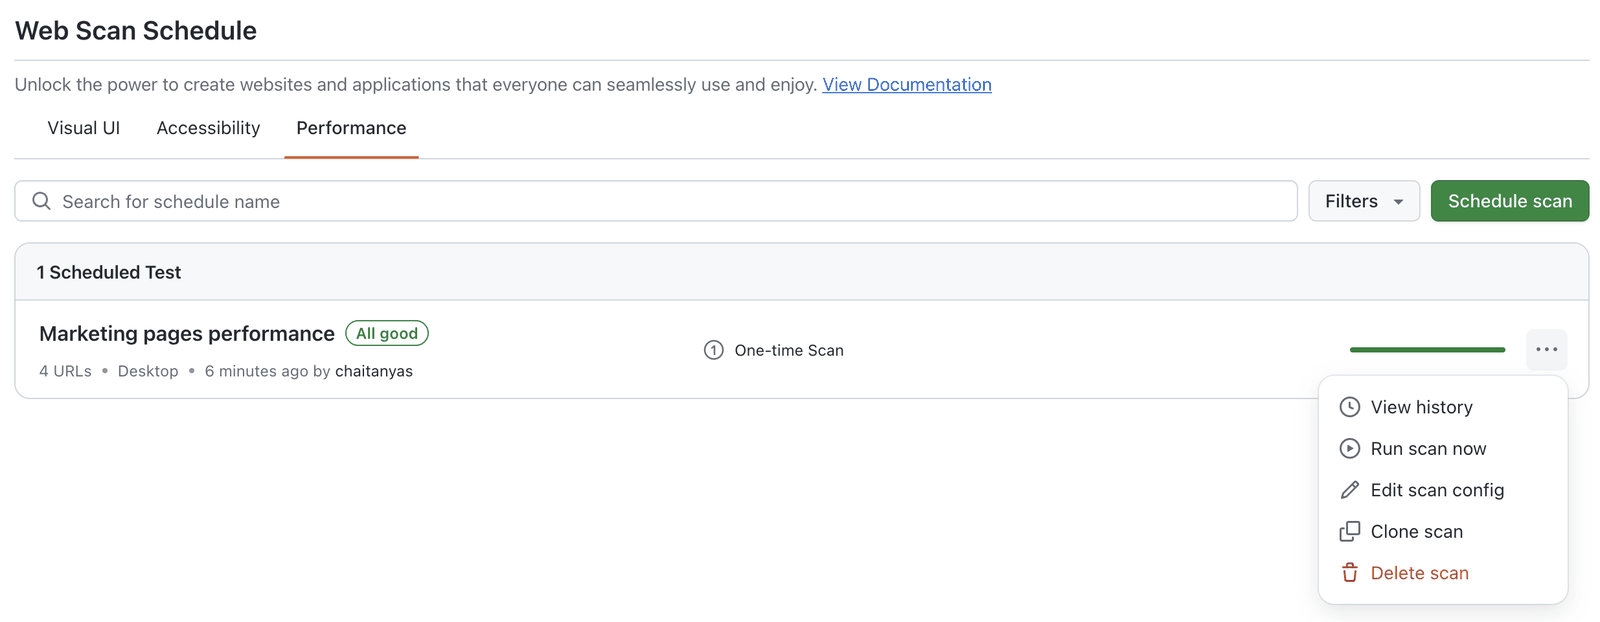
The Performance tab lists your performance scans. Each row shows:
- The scan name and the result of its latest scan: All good, or Needs attention when at least one URL is Poor or failed.
- The number of URLs, the device, and when the scan last ran and by whom.
- The schedule (for example One-time Scan) and a progress bar of the URL results.
Click ⋯ on a row to open its menu:
| Option | What it does |
|---|---|
| View history | Opens the list of past scans. Clicking the scan name does the same. |
| Run scan now | Starts a scan immediately. Hidden while a scan is running or after the schedule is stopped. |
| Edit scan config | Changes the scan's settings. Hidden after the schedule is stopped. See Edit and Clone Scans. |
| Clone scan | Creates a copy of the scan with the same URLs and settings. |
| Stop recurring scan | Stops future runs of a recurring scan. Shown for recurring scans only. |
| Delete scan | Deletes the scan. |
Scan History
History lists every run of the scan, most recent first, with its result and device. Click a run to open its report.

Read the Scan Report
The scan report has two tabs, Summary and All URLs. While a scan is running, All URLs lists each URL as Queued and fills in its results as it finishes. Summary appears once the whole scan has finished.
How a URL Is Rated
Each URL gets one status, based on its three Core Web Vitals. A metric is Good at or below the first threshold and Poor above the second. The URL takes the worst rating of the three.
| Metric | Good | Needs improvement | Poor |
|---|---|---|---|
| Largest contentful paint (LCP) | 2.5 s or less | Up to 4 s | Over 4 s |
| Total blocking time (TBT) | 200 ms or less | Up to 600 ms | Over 600 ms |
| Cumulative layout shift (CLS) | 0.1 or less | Up to 0.25 | Over 0.25 |
For example, a URL with a good LCP and CLS but a TBT of 700 ms is Poor. A URL that could not be measured is Failed.
Summary Tab
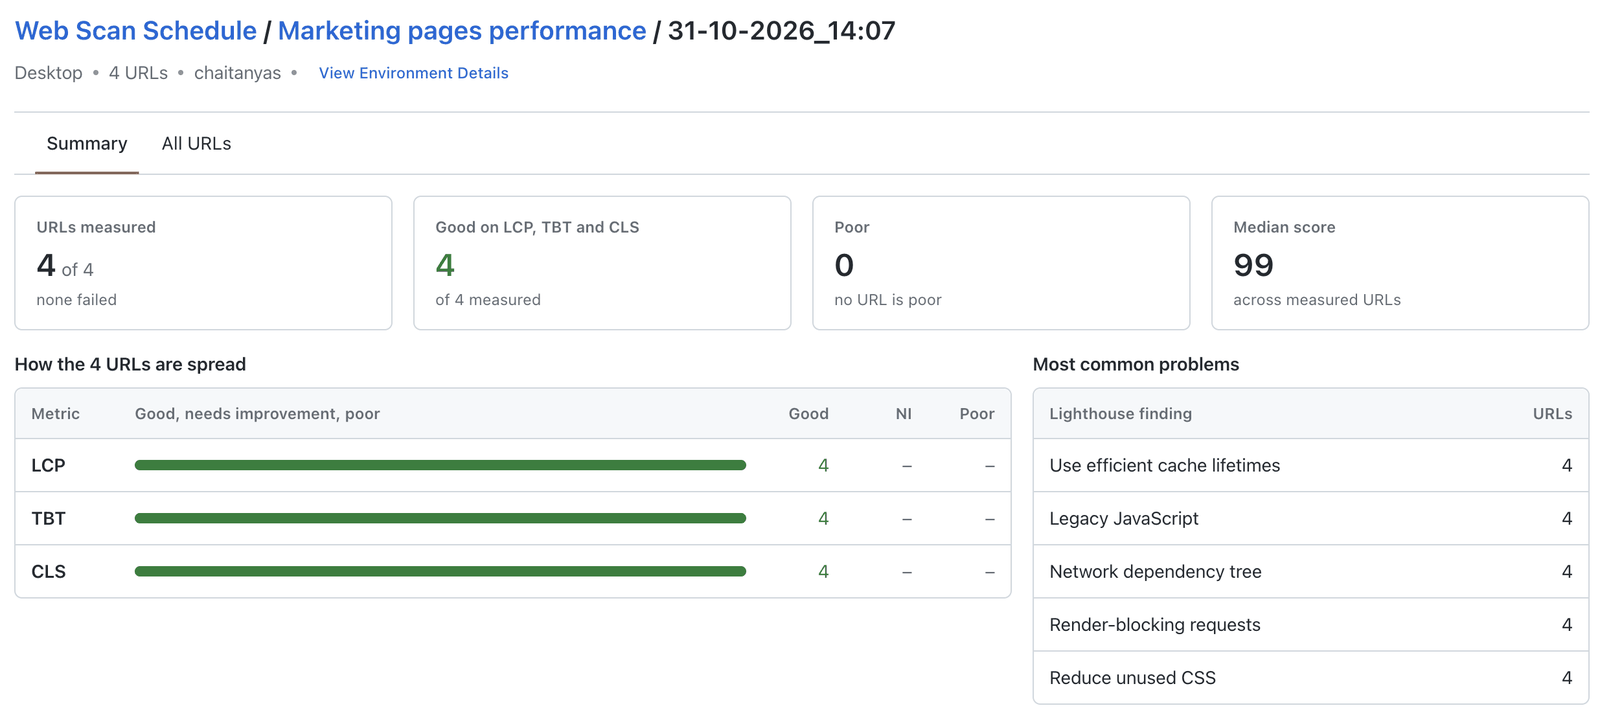
- URLs measured: how many URLs returned a result, and how many failed.
- Good on LCP, TBT and CLS: URLs rated Good.
- Poor: URLs rated Poor.
- Median score: the median Lighthouse performance score across the measured URLs.
- How the URLs are spread: for LCP, TBT and CLS, how many URLs are good, need improvement (NI) or poor.
- Most common problems: the Lighthouse findings that affect the most URLs, with a count of URLs for each.
All URLs Tab
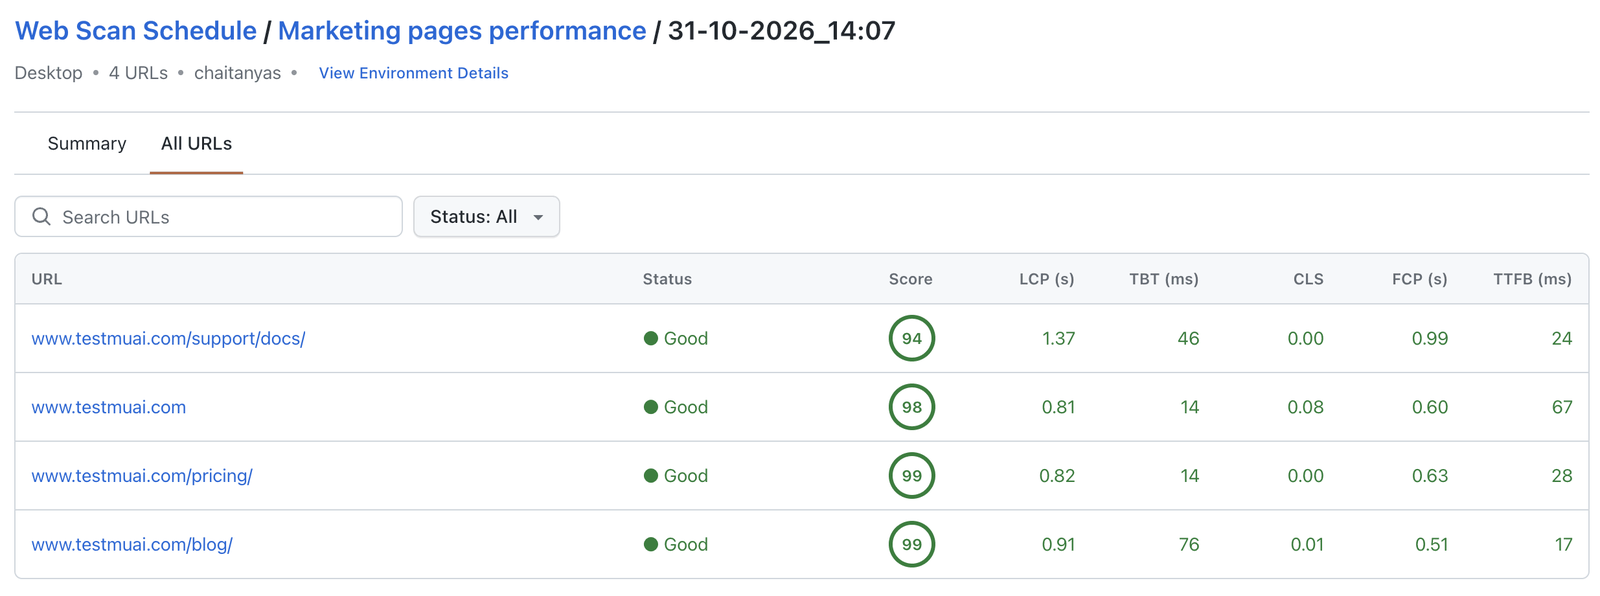
The table lists every URL with its Status, Lighthouse Score, LCP, TBT, CLS, FCP (first contentful paint) and TTFB (time to first byte). Use the search box to find a URL, and the Status filter to show only Good, Needs improvement, Poor or Failed URLs. Click a URL to open its report.
Environment Details
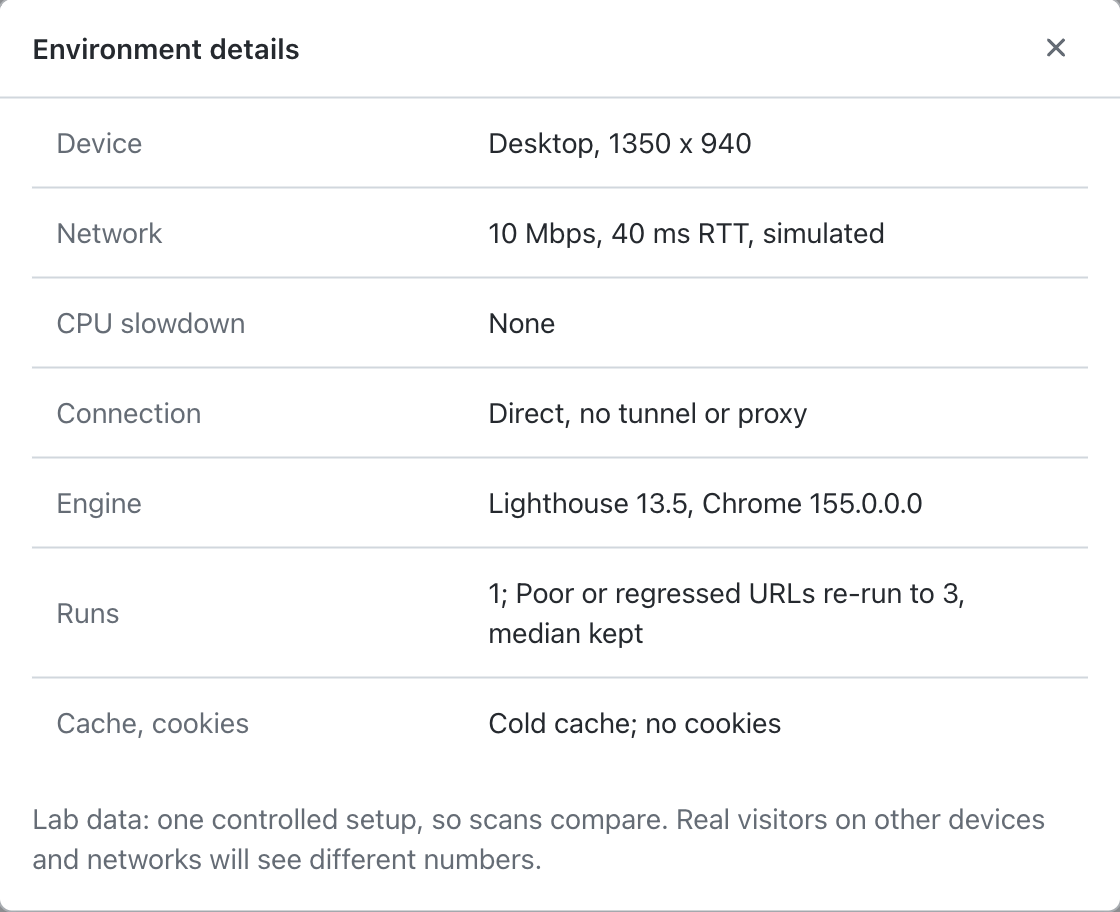
Click View Environment Details under the report title to see exactly how the scan ran: the device and screen size, network, CPU slowdown, connection (direct, tunnel or proxy), the Lighthouse and Chrome versions, the runs rule, and the cache and cookie state.
Read the URL Report
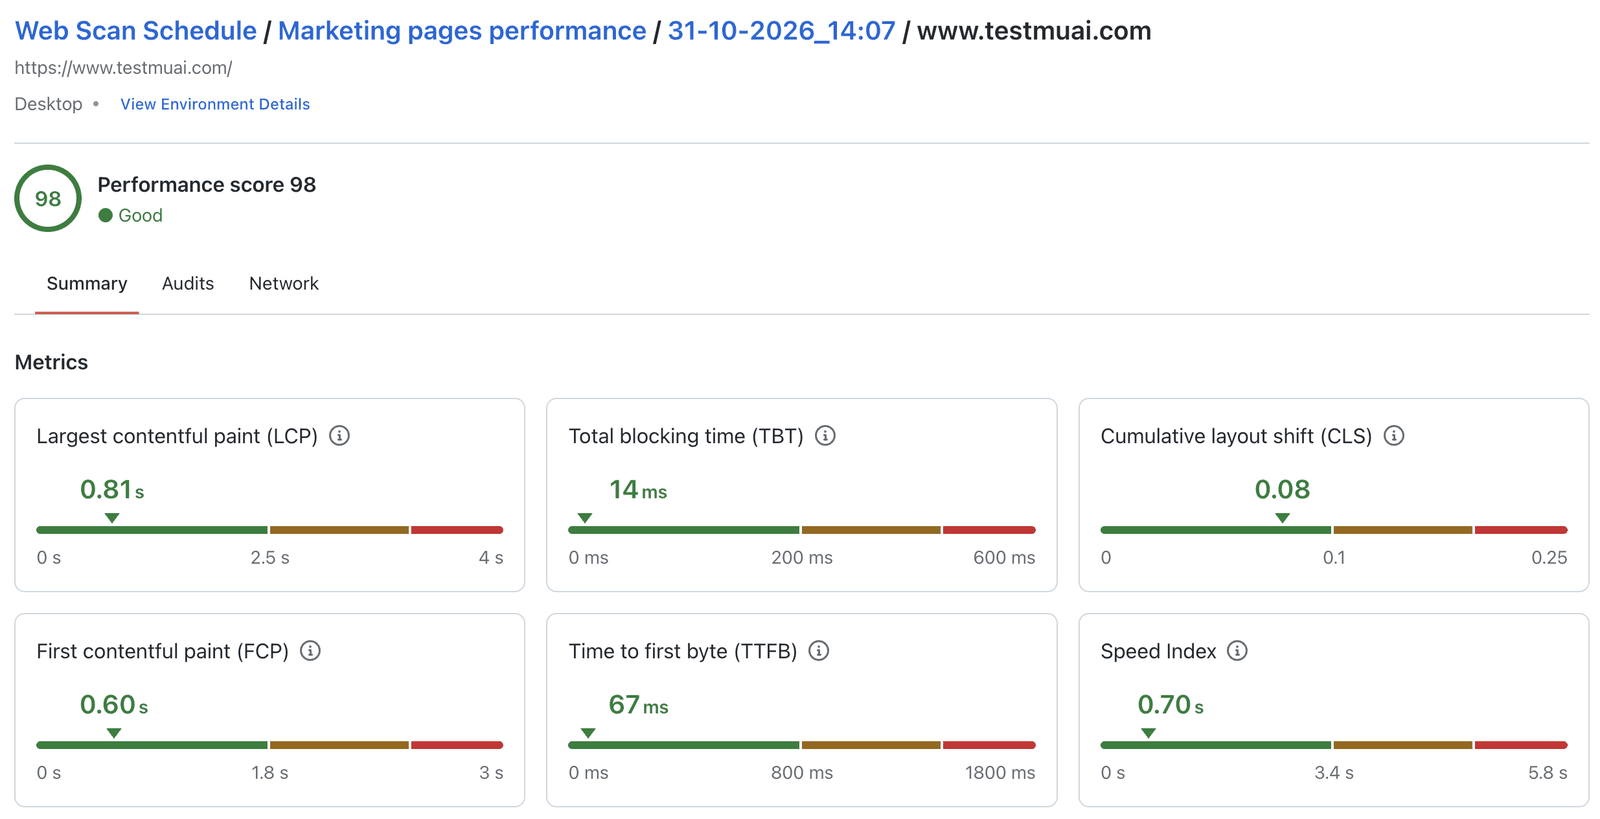
The URL report shows the full URL, and the final URL if the page redirected. The performance score and status sit at the top, above three tabs: Summary, Audits and Network.
Summary Tab
Metrics shows seven Lighthouse metrics. Each card places the value on a green, orange and red scale with the thresholds marked:
| Metric | Good | Poor |
|---|---|---|
| Largest contentful paint (LCP) | 2.5 s or less | Over 4 s |
| Total blocking time (TBT) | 200 ms or less | Over 600 ms |
| Cumulative layout shift (CLS) | 0.1 or less | Over 0.25 |
| First contentful paint (FCP) | 1.8 s or less | Over 3 s |
| Time to first byte (TTFB) | 800 ms or less | Over 1800 ms |
| Speed Index | 3.4 s or less | Over 5.8 s |
| Time to Interactive (TTI) | 3.8 s or less | Over 7.3 s |
Below the metrics:
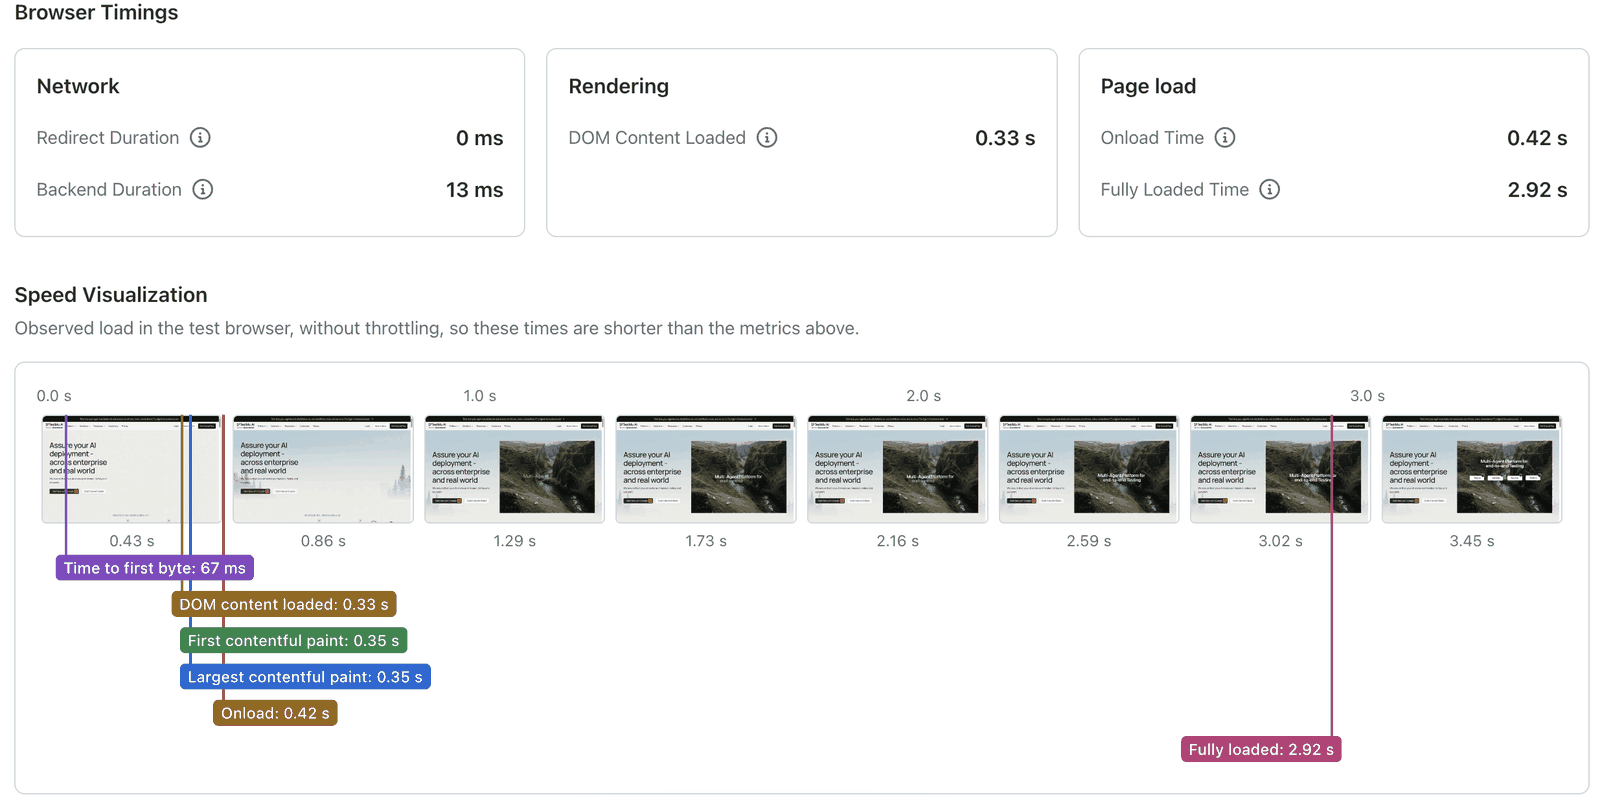
- Browser Timings groups the redirect and backend durations (Network), DOM Content Loaded (Rendering), and the Onload Time and Fully Loaded Time (Page load).
- Speed Visualization shows a filmstrip of the page as it loaded, with markers for time to first byte, DOM content loaded, first contentful paint, largest contentful paint, onload and fully loaded.
The filmstrip and browser timings are observed in the test browser without throttling, so they are shorter than the simulated metrics above them.
Audits Tab
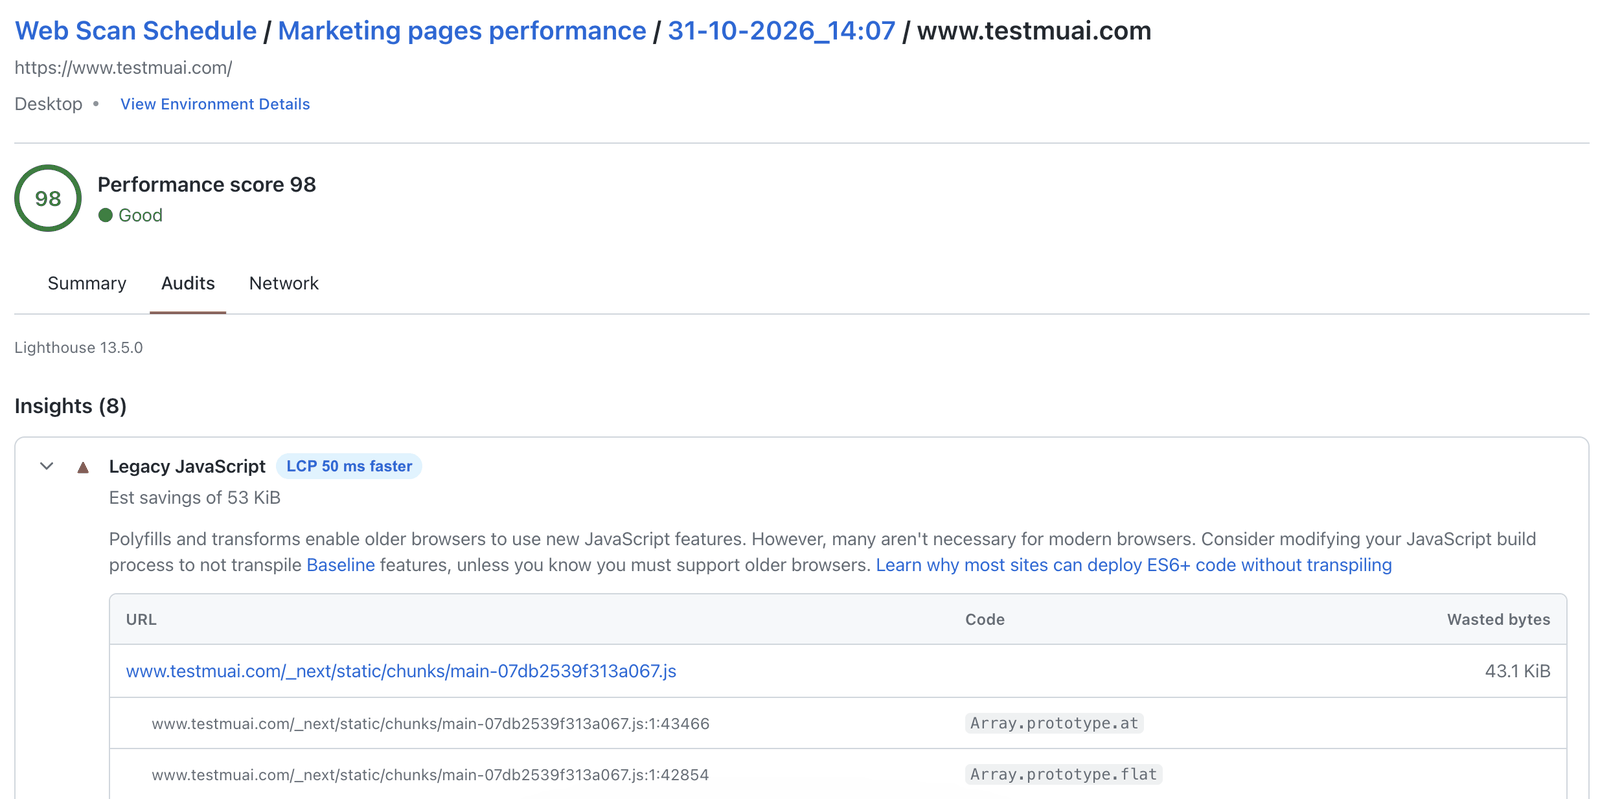
The Audits tab lists the Lighthouse findings for the URL, with the Lighthouse version at the top:
- Insights: problems with an estimated saving, such as render-blocking requests, cache lifetimes and image delivery. Badges show the metric each fix improves and by how much, for example LCP 50 ms faster.
- Diagnostics: more detail on how the page loads, such as unused CSS and JavaScript or long main-thread tasks.
- Passed audits: the checks the page already passes.
Expand a finding to see its description and the resources behind it.
Network Tab
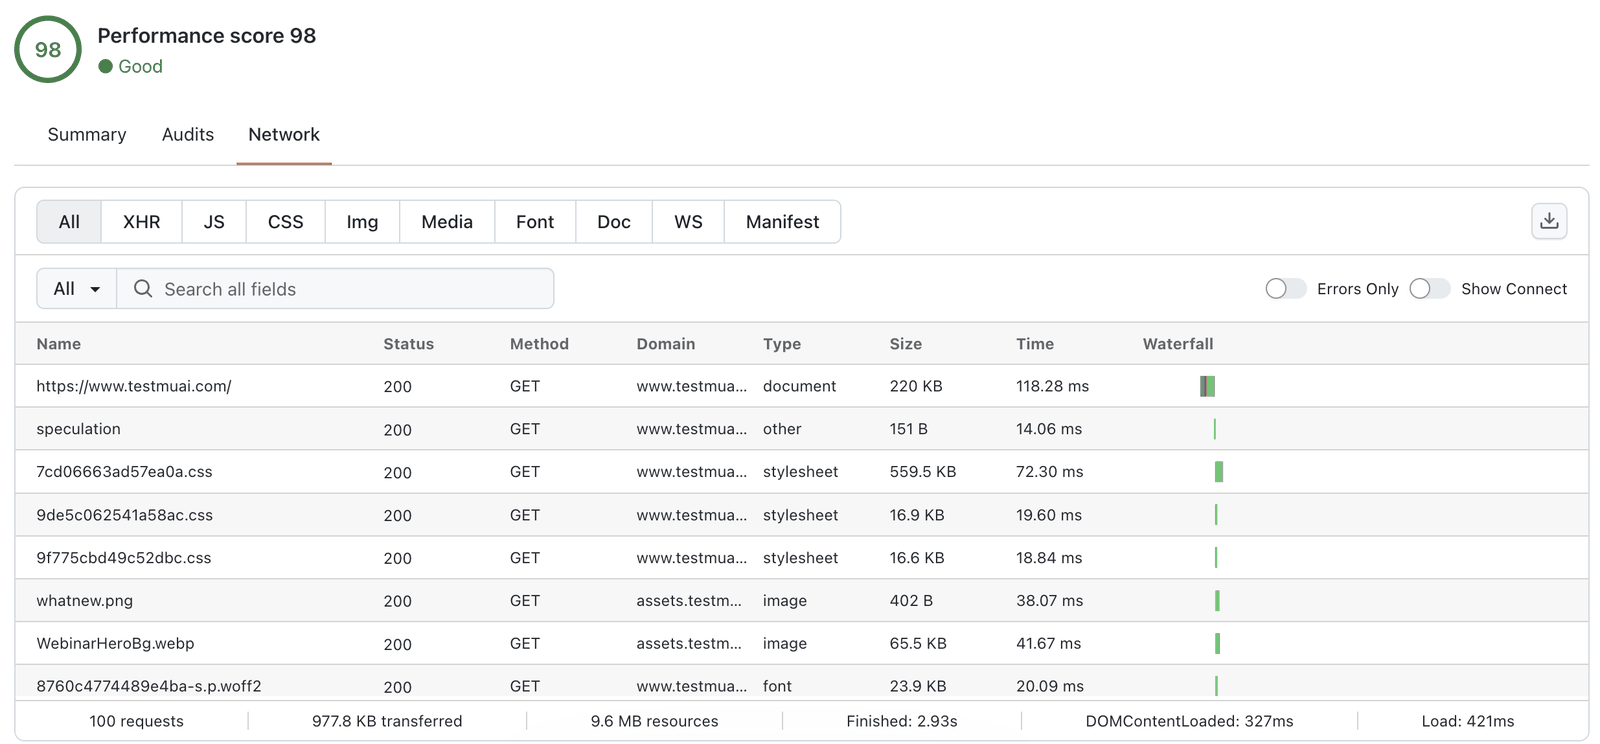
The Network tab shows every request the page made while it loaded, with its status, method, domain, type, size, time and a waterfall. You can:
- Filter by request type: All, XHR, JS, CSS, Img, Media, Font, Doc, WS or Manifest.
- Search all fields, and turn on Errors Only or Show Connect.
- Click the download icon (Download HAR Logs) to save the network log as a HAR file.
The footer totals the requests, the bytes transferred and the load timings. A URL that failed to load has no network log.
 Chat with Us